Data query
This topic introduces how to perform GQL queries and navigate around the query console in NebulaGraph Cloud.
Prerequisites
- A database instance is created. For more information, see Create a database instance.
- To perform the operations in this topic, you must be granted related roles. For more information, see Account user management.
Perform queries
Required role: Project Admin or Project Member
-
In NebulaGraph Cloud, switch to the project you want to use, and click the name of the database to view the database details.
-
On the left-side navigation pane of the database details page, click Query.
-
On the Query page, enter a GQL statement in the input area.
For how to write GQL queries, see GQL guide.
For how to navigate around the console, see UI components.
UI components
The following figure shows the console UI.
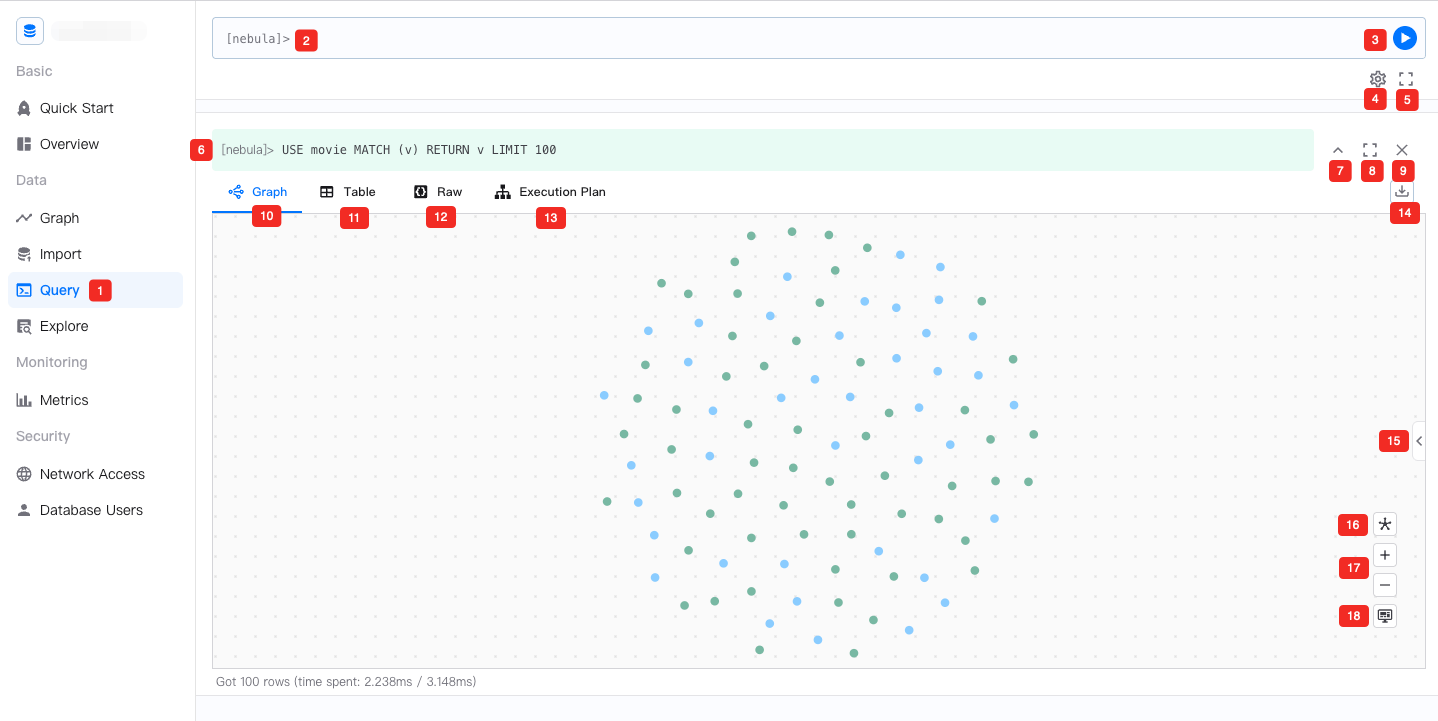
The following table lists the UI components of the console.
| No. | Component | Description |
|---|---|---|
| 1 | Entry | The entry point of the query console. |
| 2 | Input area | The area where GQL queries are entered. The input is displayed in different colors based on the syntax type. Auto-completion is supported. Comments must start with double slashes( //). Right-clicking a character string displays a context menu that provides options such as Change All Occurrences, Cut, Copy, and Command Palette. |
| 3 | Run button | Execute the GQL query in the input area. You can also press Shift + Enter to execute the query. |
| 4 | Settings | Set the query timeout and the maximum number of nodes to be displayed on the canvas. For more information, see Console settings. |
| 5 | Input area full screen button | Display the input area in full screen. |
| 6 | Executed query | Display the executed query and its running status. The query is displayed in green if the execution is successful and in red if it fails. You can click a query to paste it into the input area. |
| 7 | Fold screen button | Fold the execution result window. |
| 8 | Full screen button | Display the execution result window in full screen. |
| 9 | Close button | Close the execution result window. |
| 10 | Graph window | Display the execution result as a graph. You can click the nodes and edges in the graph to view their details at the bottom of the window. The Graph window is not displayed if the execution result cannot be visualized as a graph. |
| 11 | Table window | Display the execution result in a tabular format. You can click the column header to sort the data. After switching to the table window, you can click  to search for the data within the table. to search for the data within the table.The Table window is not displayed if the execution result cannot be rendered into a table. |
| 12 | Raw data window | Display the execution result in JSON format. |
| 13 | Execution Plan window | Display the execution plan of the executed query. For more information, see Viewing execution plans. |
| 14 | Export button | Export the execution result. The supported format includes PNG, CSV and JSON. The PNG format is not available if the execution result cannot be visualized as a graph. |
| 15 | Unfold button | In the Graph window, unfold the graph details pane to display the nodes and edges by types. In the Execution Plan window, unfold the execution plan details pane to display operator information. |
| 16 | Canvas data layout | Set the layout of the canvas data. Up to 8 layout methods can be set. |
| 17 | Zoom in/out button | Zoom in or out the canvas. |
| 18 | Move button | Move the canvas window. |