Viewing execution plans
The query console supports the PROFILE and EXPLAIN commands to generate execution plans for GQL queries.
Execution plans are rendered in the Execution Plan window. You can zoom in and out, and move the execution plan on the canvas. You can also view the execution plan window in full screen.
PROFILE command
The query console automatically runs the PROFILE command when you execute a GQL query.
Execution plan window description
The following figure shows a sample execution plan returned by the PROFILE command:
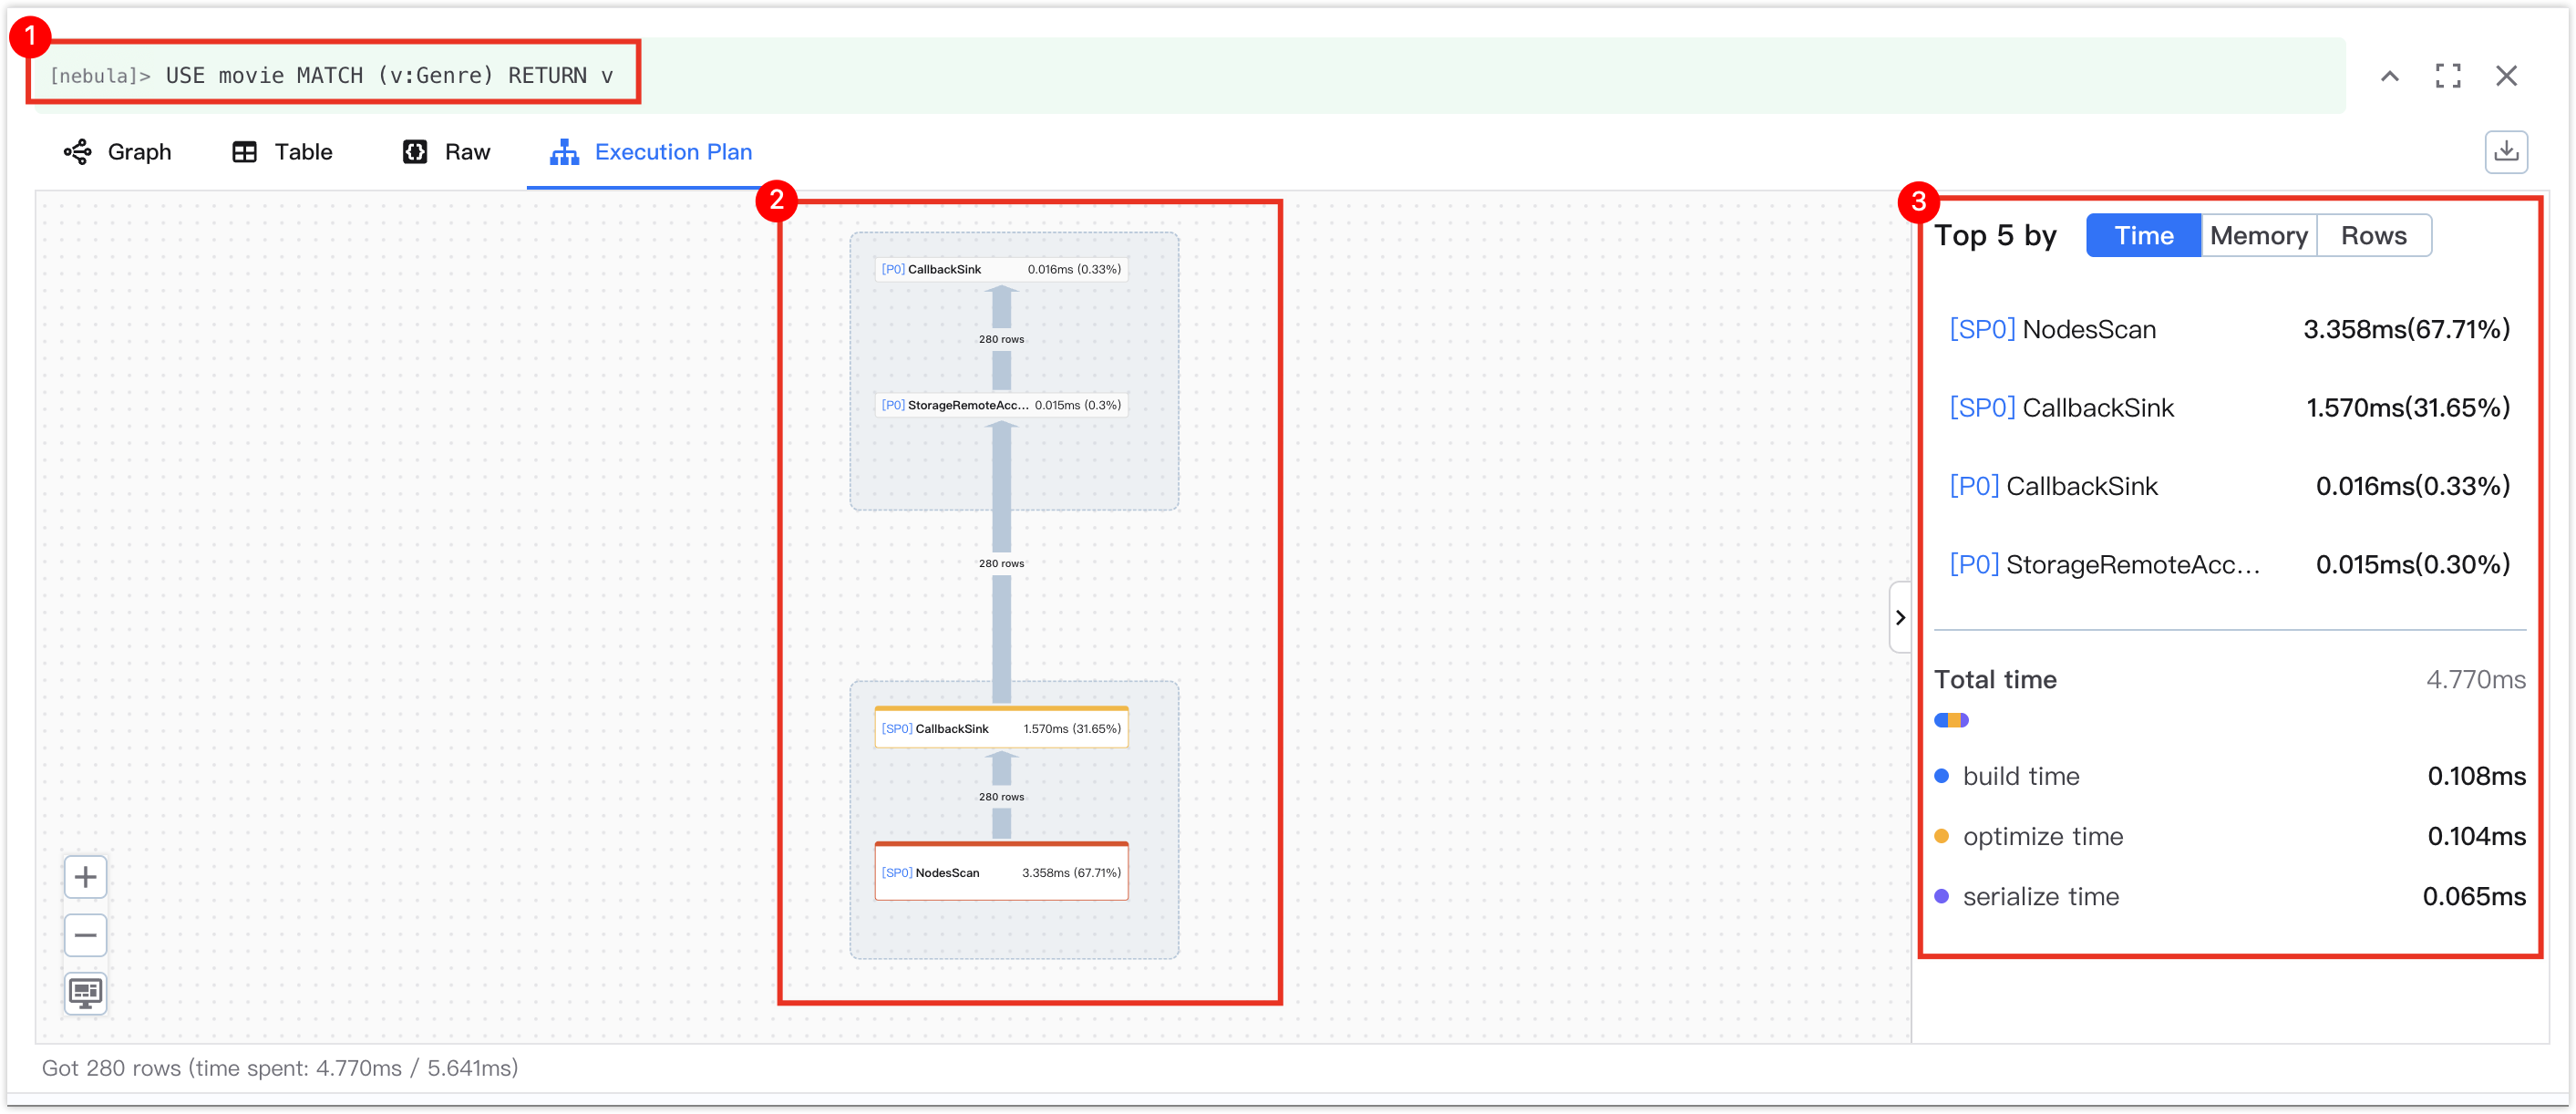
The following table describes the different parts in the execution plan.
| No. | Part | Description |
|---|---|---|
| 1 | Executed query | Displays the GQL query you executed and its running status. The query is displayed in green if the execution is successful and in red if it fails. |
| 2 | Operator execution process | Displays operators in execution order. For each operator, the name, execution time, and memory usage are displayed. Operators are highlighted according to their execution time. The more time-consuming the operator, the deeper the color. Arrows depict data flow and indicate the number of rows; the thicker the arrow, the more rows it represents. If you click an operator, the details of the operator are displayed on the detailed information pane. The details are returned by using the verbose format when running the PROFILE command. For more information, see PROFILE. |
| 3 | Detailed information pane | Displays the top 5 operators by execution time, memory usage, and row count. You can click an operator to locate it in the operator execution process. Displays the total execution time, as well as build time, optimization time, and serialization time. |
EXPLAIN command
If you do not want to execute a GQL query but only want to view its execution plan, you can add the EXPLAIN command before a GQL query and click the Run icon to generate the execution plan. In this case, only the Execution Plan window is displayed in the execution results.
Execution plan window description
The following figure shows a sample execution plan returned by the EXPLAIN command.
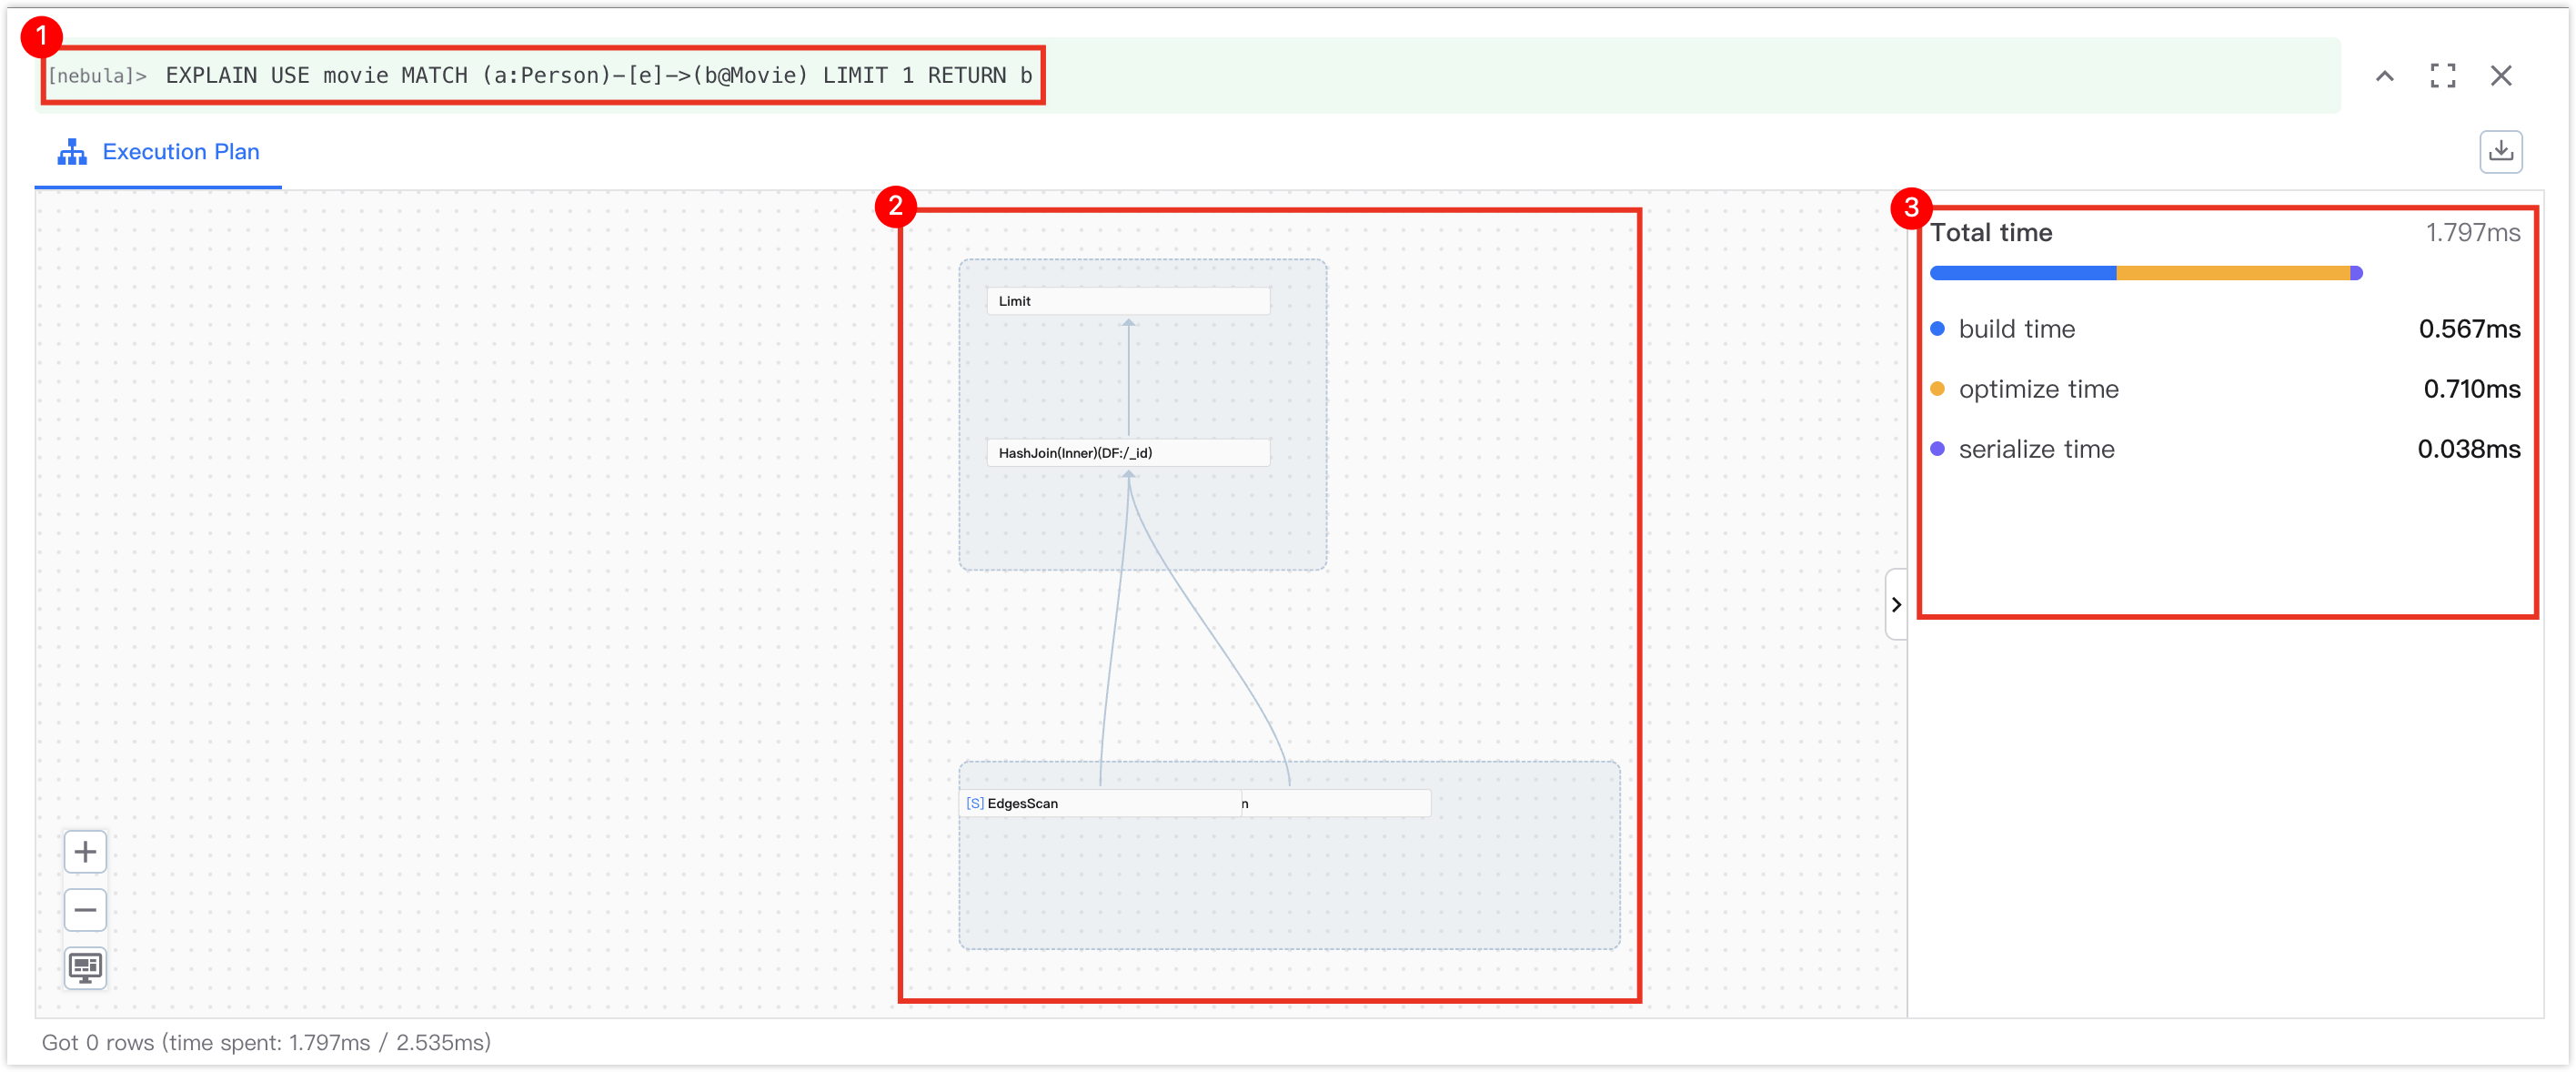
The following table describes the different parts in the execution plan.
| No. | Part | Description |
|---|---|---|
| 1 | Explained query | Displays the explained query. The query is displayed in green if it is valid and in red if it is invalid. |
| 2 | Operator execution process | Displays operators in estimated execution order. If you click an operator, the details of the operator are displayed on the detailed information pane. |
| 3 | Detailed information pane | Displays the total estimated execution time, as well as build time, optimization time, and serialization time. |