
NebulaGraph Explorer
Visualize your data, find insight in seconds!
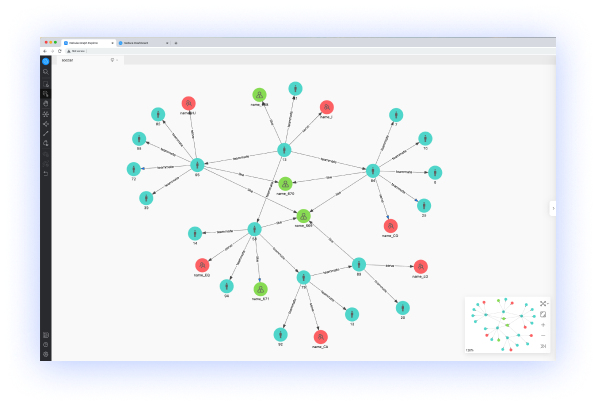
NebulaGraph Explorer is a web-based graph exploring tool. It works with the NebulaGraph DBMS and enables data scientists and business analysts to query and analyze a large volume of data without having to write any graph query language. You can easily gain business insight from the query results that are visually displayed on the canvas.
The shortest path to insights
NebulaGraph Explorer is built on top of the Nebula Graph query engine, providing fast and interactive graph exploration capabilities to you quickly find hidden connections and insights from you data.
Advantages
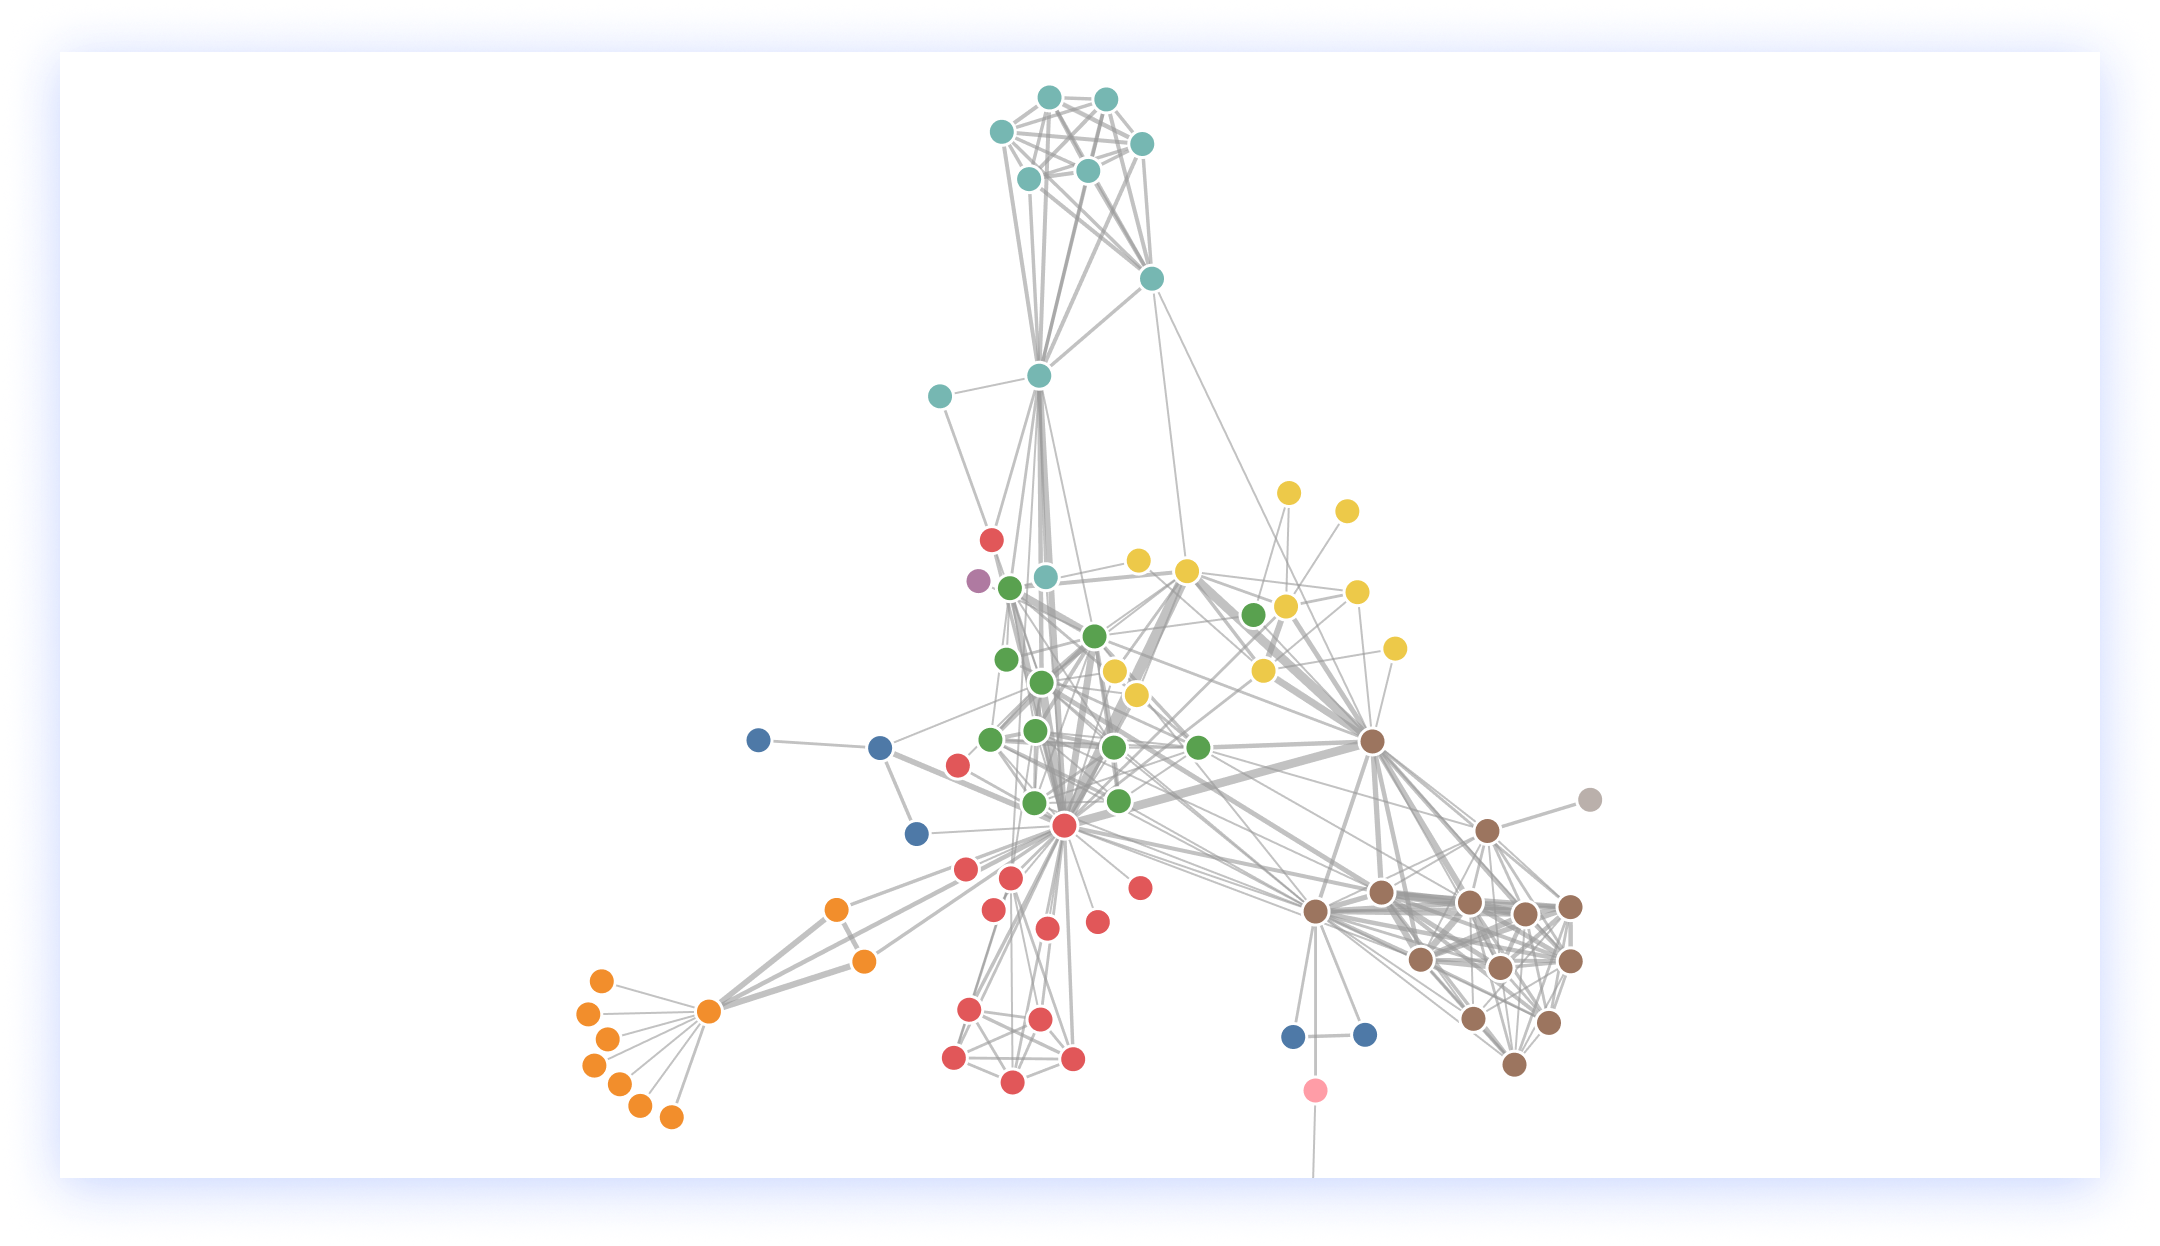
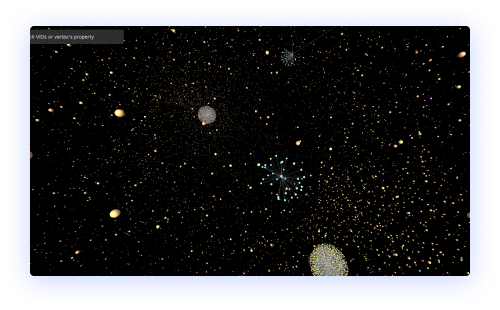
Visualize connected data in a straightforward way
Easy to use and user-friendly
NebulaGraph Explorer can be deployed in simple steps. And use simple visual interaction, no need to conceive nGQL sentences, easy to realize graph exploration.
Powerful and flexible
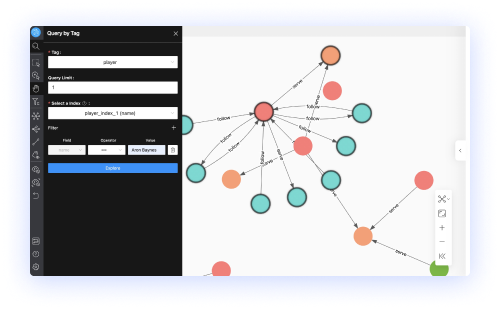
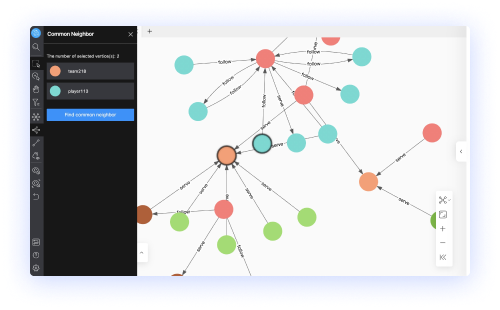
NebulaGraph Explorer supports querying data through VIDs, Tags, and Subgraphs. NebulaGraph Explorer supports operations such as expanding operations on multiple vertices, querying the common neighbors of multiple vertices, and querying the path between the start vertex and the end vertex.
Beautifully presented
NebulaGraph Explorer supports modifying the color and icon of the vertex in the canvas to highlight key nodes. You can also freely choose the data display mode.
Features
Get a 360° view of your data
Plenty of query methods to display data
- You can query data by VIDs, Tags, and by Subgraphs. NebulaGraph Explorer also supports importing data randomly or from local files. You can limit the number of output results and filter the results. You can also view the subgraph of one or more vertices and specify the number of steps, edge types, and the direction of inflow and outflow of the subgraph, and then the data will be visualized on the canvas.
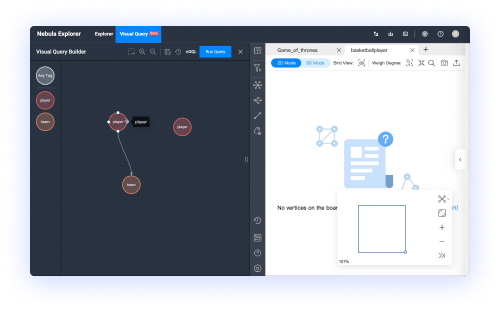
Uncover hidden connections
- You can select two or more vertices on the canvas and query their common neighbors. You can also customize the type and direction of the edge, specify the number of query steps, and choose to query the following three types of path: all path, shortest path, and no-loop path.
Make the invisible visible
- Supports 2D and 3D view mode switching, allowing users to explore graph data from different perspectives, and enhancing the user's sense of exploration. It also supports editing the color, size, and other attributes of nodes in the canvas.
Workflow graph analysis
- Flexibly manage multiple graph-computing methods using workflows, seamlessly integrating graph query, subgraph computing, and complete graph computing.
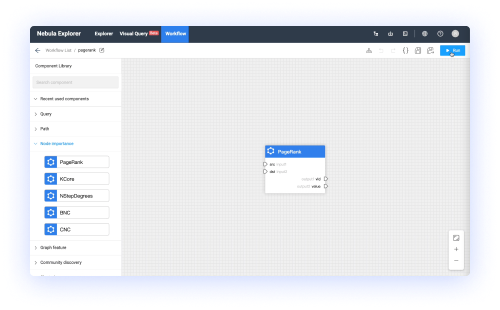
No-code graph query
- Generating graph query languages in a WYSIWYG way using drag and drop.
Why NebulaGraph Explorer?
Everybody can play around with a graph database
You need to quickly find neighbor relationships from complex relationships, analyze suspicious targets, and display graph data in a visualized manner.
You need to filter, analyze, and explore a large data set in a visualized way.
Demo Video
Ready to Get Started?
