LLM
BioGraphRAG - Biomedical Knowledge Graph Retrieval Augmented Generation
About the author
Diya Mandot is a Computer Science and Design student who believes technology is ultimately about people. Whether she's building backend APIs, designing user-friendly interfaces, or diving into the nuances of AI, her goal is always to create solutions that are both powerful and intuitive. Her journey has taken me through corporate IT, AI training, and full-stack development, giving her a unique perspective on how technology shapes our world. When she's not coding, you'll find her exploring a new city, practicing classical Indian art, or hunting for the perfect cup of coffee—all things that fuel her curiosity and drive to keep learning.
The article was originally published at https://kunjrathod.substack.com/p/f11c8248-3d58-4d4b-b70e-95d79b7a2a96
Abstract
LLMs and RAGs have emerged as technologies that have proven their utility in a variety of natural language processing tasks. However, their integration with domain curation knowledge bases (especially in graph databases) is relatively less explored. We present BioGraphRAG, an interactive platform that uses a graph retrieval augmented generation (Graph RAG) approach, designed to enhance AI-generated responses using structured biomedical knowledge graphs. Integrating RAGs with a biomedical knowledge graph - BioKG, BioGraphRAG provides more accurate, contextual, and explainable answers to complex biomedical queries. BioGraphRAG uses NebulaGraph to store and index biomedical data, FastAPI for backend services to serve HTTP requests, and Chainlit for a user-friendly interactive interface. By leveraging curated biomedical datasets, BioGraphRAG addresses common limitations in large language models (LLMs), such as hallucinations and context inaccuracies. This tool is poised to transform medical information retrieval for healthcare professionals, researchers, and patients by offering precise, trustworthy, and scalable insights. Future enhancements aim to expand data sources, improve user interaction, and optimize high-degree node processing to ensure efficient querying in large biomedical graphs.
The code for this work can be found here: BioGraphRAG GitHub Repo.
This project was completed as part of the Garge Marathi Summer of Code program, organized by MAAI. You can check out the team's internship experience here How My Summer Internship Kickstarted My Tech Journey (and How I Thrived Through It!)
Overview
Introduction to BioGraphRAG
BioGraphRAG is an advanced application of LLMs in the biomedical domain that provides LLMs with expert-curated knowledge graphs to provide insights into biomedical queries using local and global structures of biomedical knowledge graphs. Combining concepts from Retrieval-Augmented Generation (RAG) with an expert-curated knowledge graph, BioGraphRAG integrates structured, verified biomedical data to provide accurate, explainable, and comprehensive medical responses. This system is invaluable for healthcare professionals, researchers, and patients, bridging the gap between generic AI models and the complexities of real-world medical information.
The platform features a user-friendly frontend built with Chainlit and a robust backend powered by FastAPI, enabling efficient interactions and request handling. Users can interact with the knowledge graph via NebulaGraph Studio and manage entity mappings with dedicated scripts. By sourcing data from validated biomedical databases, BioGraphRAG improves response accuracy, reduces misinformation, and provides detailed, contextual answers to complex medical questions.
In addition, we propose interesting future directions to further improve BioGraphRAG:
1) Optimizing high-degree node handling in BioKG—such as highly connected genes or proteins—will reduce query latency through advanced caching and parallel processing.
2) Expanding data sources to include more biomedical information will provide more nuanced responses
3) Enhancing the user interface for greater intuitiveness, with interactive visualizations and improved conversational features in the Chainlit frontend web app.
4) Additionally, real-time data updates and dynamic adjustments to the knowledge graph will keep BioGraphRAG current with the latest research.
5) Finally, scalability will be increased to handle growing datasets and user demands, ensuring BioGraphRAG remains a leading tool for biomedical research and healthcare decision-making.
Motivation
What are LLMs?
Large Language Models (LLMs) are advanced AI systems designed to understand and generate human-like text. They are built on transformer architectures, which excel at analyzing sequences of words by identifying relationships between them using mechanisms like self-attention. Unlike older models, transformers process text in parallel, making LLMs faster and more efficient.
LLMs are trained on vast amounts of text data, such as books, articles, and web content, allowing them to learn language patterns, context, and even some real-world knowledge. Training happens in two phases: pretraining, where the model predicts missing words in sentences, and fine-tuning, where it's customized for specific tasks. Models like GPT-4, BERT, and T5 are examples, each optimized for different language tasks like content generation, context understanding, and text-based tasks. Their strength comes from billions of parameters that help them generalize language, enabling them to handle complex NLP tasks like answering questions or summarizing texts.
Despite challenges, LLMs have revolutionized language-based AI, powering applications like chatbots, translation tools, and content creators, and continue to evolve as essential tools in natural language processing.
Limitations of LLMs
While LLMs are transformative (pun intended) in the field of AI and natural language processing, they come with several limitations. LLMs rely heavily on their training data, which can become outdated, and ingesting new information is resource-intensive, limiting their ability to stay current. They lack access to proprietary enterprise datasets and may generate inaccurate information based on learned patterns rather than verified facts. Additionally, they struggle with long-term contextual understanding and are computationally expensive to train and deploy. LLMs can also perpetuate biases present in their training data, further limiting their accuracy and fairness in real-world applications.
- Reliance on Trained Data
LLMs are trained on large datasets collected up to a certain point in time. This means they might not be aware of recent events or the latest information, leading to outdated or irrelevant responses. Since they don't have real-time learning capabilities, their knowledge base remains static until they are retrained with new data—a process that is both costly and time-consuming.
- Costly to Ingest New Information
The process of updating LLMs with new information involves retraining them on additional data, which requires substantial computational resources and time. The rate at which new data is generated globally far exceeds the rate at which LLMs can be updated. This makes it challenging for LLMs to stay current, limiting their effectiveness in rapidly changing fields where up-to-date information is crucial.
- Limited Understanding of Proprietary Data
Most LLMs are developed using publicly available data and lack access to proprietary or confidential datasets that many enterprises possess. As a result, they cannot directly utilize or understand the specialized information contained within these private datasets. This limitation hinders their applicability in enterprise environments where domain-specific knowledge is essential for tasks like decision-making, analytics, and personalized customer interactions.
Given these limitations, researchers and developers have been exploring ways to enhance the capabilities of LLMs while mitigating their shortcomings. One promising approach that addresses several of these issues is Retrieval-Augmented Generation (RAG). This innovative technique combines the power of LLMs with the ability to access and incorporate external, up-to-date information, potentially overcoming many of the abovementioned limitations.
But what is Retrieval-Augmented Generation (RAG)?
Retrieval-Augmented Generation (RAG) is an innovative AI technique that enhances Large Language Models (LLMs) by integrating external data retrieval into the text generation process. This approach is crucial as it allows LLMs to access up-to-date information beyond their training data cutoffs, ensuring that responses are relevant and timely. By querying specialized databases, RAG enables LLMs to provide accurate answers in niche fields, thereby incorporating domain-specific expertise. Additionally, grounding responses in retrieved data helps minimize the risk of generating fabricated information, commonly known as hallucinations. RAG also improves the relevance of responses by incorporating pertinent external information, which enhances contextual understanding. Furthermore, it allows LLMs to utilize company-specific or confidential data not included in public training sets. By addressing these limitations, RAG significantly enhances the versatility and accuracy of LLMs, making them more effective for a wide range of applications.
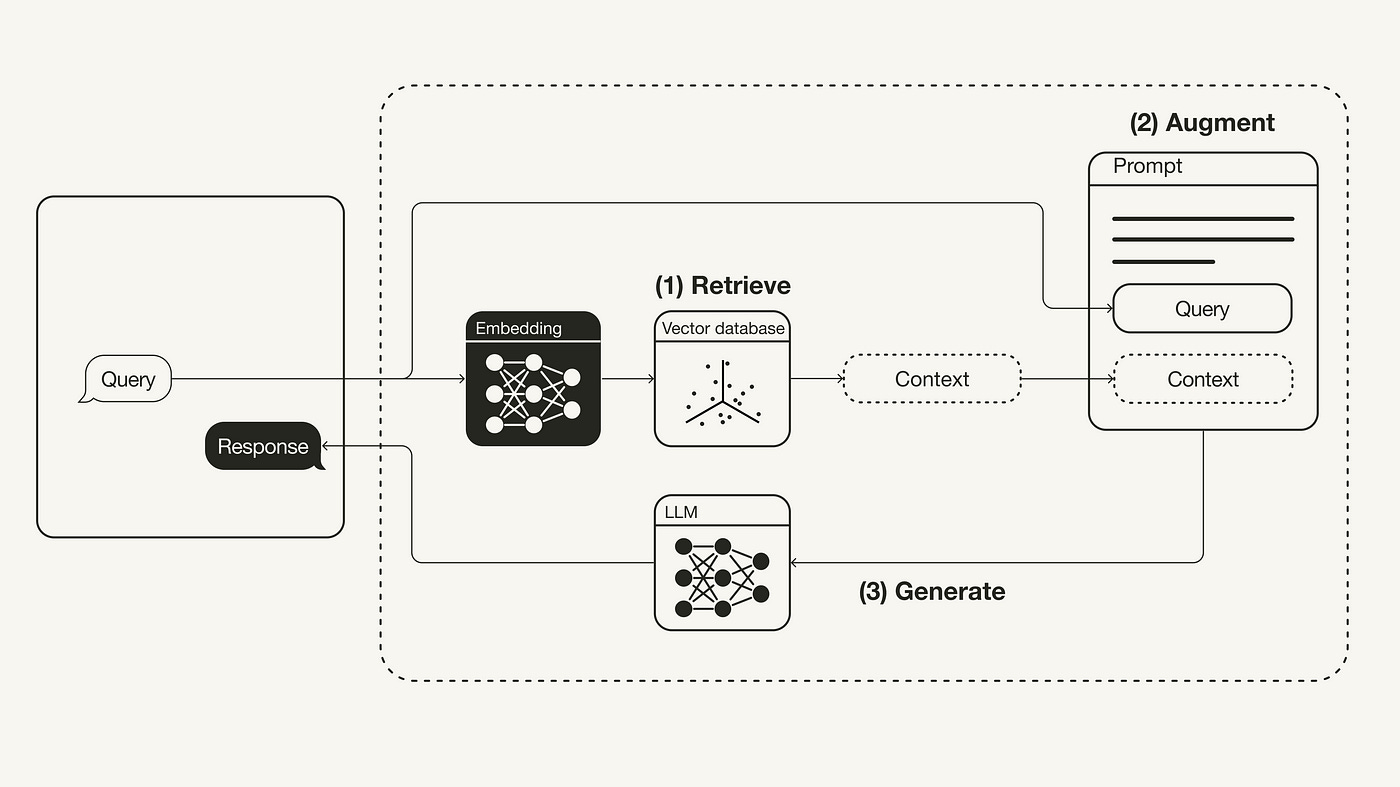 Fig1. https://towardsdatascience.com/retrieval-augmented-generation-rag-from-theory-to-langchain-implementation-4e9bd5f6a4f2
Pros of RAG:
Improved Accuracy: By pulling real-time data from external sources, RAG reduces hallucinations, providing more precise answers.
Contextual Relevance: BioGraphRAG delivers responses tailored to the specific context by retrieving relevant information.
Faster Adaptation: RAG doesn't require retraining to incorporate new information, as it can access updated data in real-time.
Cons of RAG:
Quality Dependency: The quality of responses depends on the relevance of the retrieved data—poor retrieval leads to poor answers.
System Complexity: Implementing RAG involves integrating both retrieval and generation systems, making it more complex to design and maintain.
In-comprehensive Document understanding: Since RAGs uses document chunks to arrive at the answers, it doesn’t have a capacity to understand how various documents and chunks are related to each other.
Structured Datasets: While RAGs work well on unstructured datasets like docs and pdf files they suffer to handle graph datasets and other structured datasets.
RAG offers a powerful way to make LLMs more accurate and adaptable, though it comes with trade-offs like potential delays and added system complexity. While traditional RAG systems retrieve information from external databases to enhance the generation process, they have limitations, especially in complex domains.
This is where Graph-based RAGs offer a powerful solution to the challenges of accuracy and data integration in complex fields over vanilla RAGs. By leveraging the structure of knowledge graphs, they provide more reliable, contextually aware, and traceable responses—making them invaluable in domains where precision is non-negotiable.
Factual Accuracy in the Biomedical Domain: In areas like biomedicine, factual correctness is paramount. Misinterpretation or inaccuracy can have serious consequences. Graph based RAGs improve accuracy by utilizing knowledge graphs—structured networks of verified information that map relationships between biological entities. This ensures responses are not only relevant but also factually reliable, which is essential for providing safe and accurate information in healthcare.
Regulations and Compliance: Industries such as healthcare operate under strict regulations, requiring transparency and traceability of data. Graph RAGs enhance compliance by making it easier to track the source and relationships of retrieved data. This traceability supports auditability, ensuring that responses are not only accurate but also align with regulatory standards.
Diverse and Scattered Datasets: Data in domains like Biomedicine is often fragmented across multiple sources—like research papers, clinical trials, and medical databases. Graph RAGs excel at integrating this scattered information by mapping it onto a unified knowledge graph, providing a clearer, more comprehensive understanding of complex queries. This capability helps generate more meaningful and insightful responses, making it easier to derive connections between scattered data points.
What are Graph-based RAGs and why do we need them?
Graph-based Retrieval-Augmented Generation (RAG) enhances RAG systems by integrating knowledge graphs into the retrieval process. These graphs map complex relationships between entities, enabling more nuanced, context-aware retrieval. This approach is particularly valuable in fields like biomedicine, law, and finance, where precise, interconnected information is essential. For instance, in biomedicine, a Graph-based RAG can use a knowledge graph of genes, proteins, and diseases to deliver more accurate and comprehensive responses.
In our literature research, we found some work that tries to solve similar problems that we list here:
Existing Graph based Retrieval Augmented Generation Work
KG-RAG combines a knowledge graph (KG) with a large language model (LLM) by extracting "prompt-aware context," the minimal information needed to answer a query. Using the SPOKE biomedical KG with over 27 million nodes and 53 million edges, it enhances the LLM's responses with precise, domain-specific knowledge.
KRAGEN combines knowledge graphs, Retrieval Augmented Generation (RAG), and advanced "graph-of-thoughts" (GoT) prompting to solve complex problems by breaking them into subproblems and retrieving relevant knowledge. It uses a vector database and a custom GoT viewer, allowing users to interact with the solution's logic and reduce hallucinations.
Current work
Introduction - Technical Overview
BioGraphRAG is a specialized biomedical knowledge management system that leverages NebulaGraph and Retrieval-Augmented Generation (RAG) to deliver accurate and contextually rich insights into the BioKG knowledge graph. It is built to bridge the gap between AI-driven text generation (good at understading unstructured texts) and the real-world complexity of biomedical data (captured by expert curated datasets such as biomedical knowledge graphs). By integrating a Biomedical Knowledge Graph (BioKG), BioGraphRAG enhances information retrieval, offering precise and explainable responses to user queries, making it highly suitable for applications in healthcare and biomedical research. In order to make our tool more useful and accessible, we use we have built a chatbot powered by Chainlit, used FastAPI for backend API development, NebulaGraph for database management, and LlamaIndex for efficient indexing and retrieval of BioKG data.
Users of BioGraphRAG can expect a seamless, interactive experience powered by Chainlit. Key features include:
Query Submission: Users can easily submit queries related to biomedical topics, such as diseases, genes, or treatments. BioGraphRAG generates responses based on verified data from the BioKG knowledge graph, ensuring fact-checked, reliable information.
Visualize Relevant SubGraphs: The chatbot user interaface provides users a graphical representation of the relevant subgraphs associated with the entities extracted from the user query and visualized via graphical representations , helping users better understand complex relationships between various entity types, such as gene ontology, cell types, diseases, chemical compounds, protiens and drugs.
Explainable Responses: Each response is then further augmented with elaborate explanations by citing trustable sources for biomedical dataset such as Uniprot, . BioGraphRAG transparently traces information back to its source in the BioKG, giving users confidence in the accuracy and reliability of the data.
How is BioGraphRAG different?
BioGraphRAG differentiates itself by utilizing a large-scale biomedical knowledge graph (BioKG) constructed from over 34 million PubMed abstracts, resulting in 11,479,285 unique entities across 12 types (e.g., genes, diseases, chemical compounds) and 42,504,077 relations across 52 types (e.g., associations, positive correlations, cotreatment). This implementation creates a Graph RAG that enhances response quality through augmented biomedical context, providing a user-friendly chatbot platform for interaction and allowing users to visualize the underlying context of responses.
BioGraphRAG enhances user interaction by integrating Chainlit for user-friendly front-end interaction, while simultaneously offering visual representations of subgraphs to help users understand the relationships between biomedical entities, like genes and diseases. This level of contextual richness and explainability sets it apart, allowing healthcare professionals and researchers to retrieve both precise answers and clear reasoning behind each response. Additionally, BioGraphRAG supports the enrichment of answers with external data sources, such as protein structures or drug details, ensuring that responses are both thorough and trustworthy.
Pros of GraphRAGs
Enhanced Factual Accuracy: Leverages structured, verified data from knowledge graphs to minimize hallucinations.
Deeper Contextual Insight: Captures complex relationships between entities for more informed, context-rich responses.
Explainability: Enables traceable reasoning and source verification for transparent decision-making.
Cons of GraphRAGs
Graph Maintenance Overhead: Building and updating large-scale knowledge graphs is labor-intensive and complex.
Latency Issues: Querying large, interconnected graphs can cause performance slowdowns in real-time applications.
Data Integration Complexity: Converting diverse, unstructured data into a unified graph structure poses significant challenges.
Overall System’s Architecture
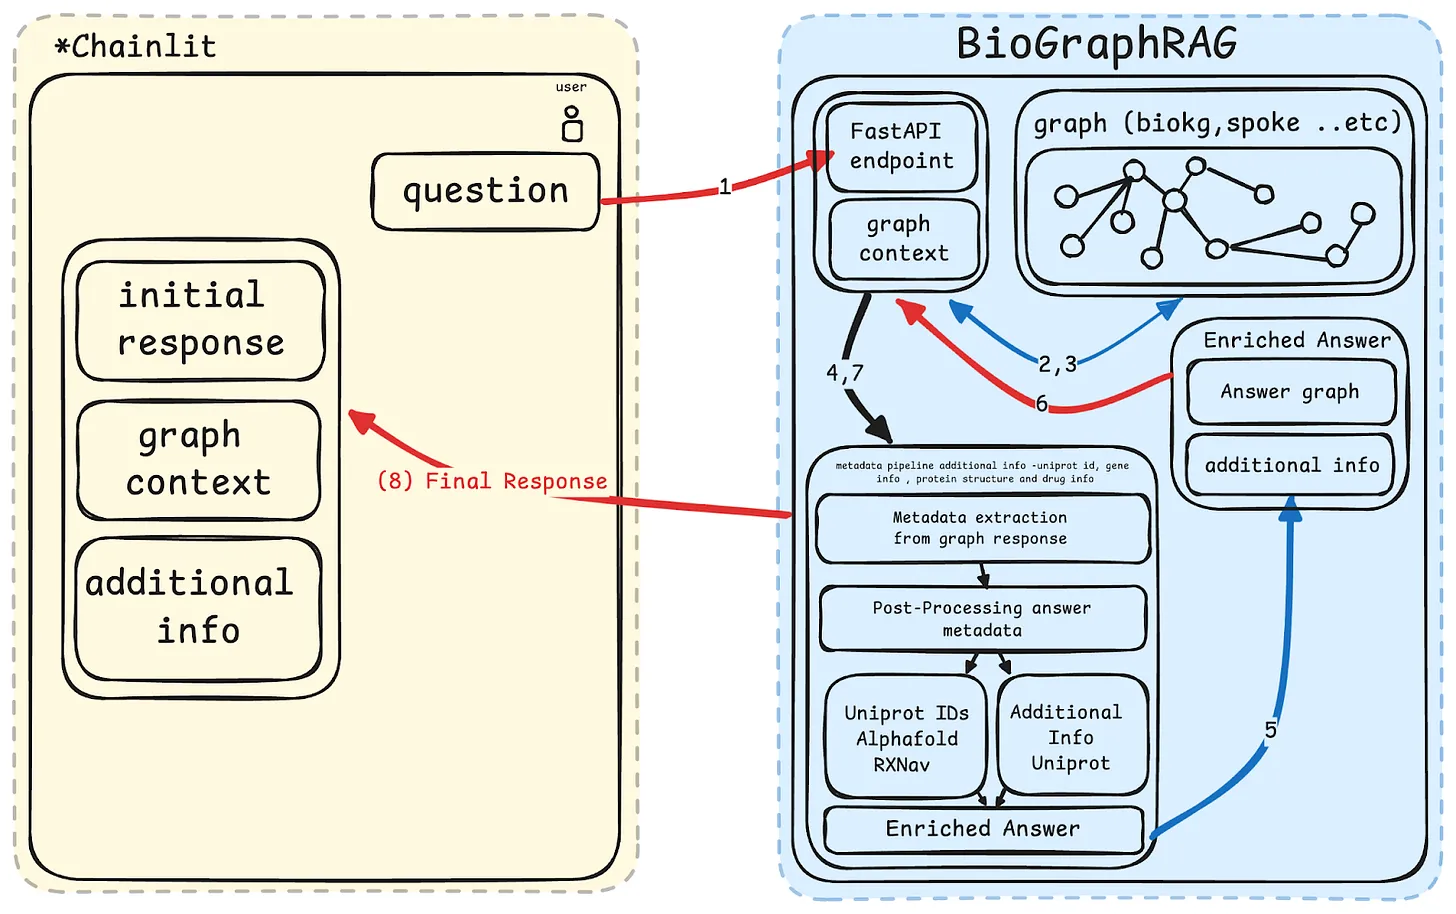 Fig.2 Overall System Architecture with flow of control
The Figure (Fig.2) illustrates the workflow of BioGraphRAG.
1) Users submit queries through the Chainlit frontend, which are processed by a FastAPI endpoint. 2) The query is then used to extract the relevant subgraph context from the knowledge graph which generates the initial response from the LLM. 3) This response is further enhanced by extracting relevant metadata (like gene or drug information) using LLM APIs and additional external sources. 4) The final enriched answer, including the metadata and additional insights, is then displayed back to the user in the Chainlit interface.
Following are the various components of the BioGraphRAG architecture:
Chainlit Frontend:
User interface where queries are submitted and responses are displayed.
Displays the initial response, graph context, and additional information.
FastAPI Backend:
Receives and processes the user queries.
Interfaces with the knowledge graph to retrieve relevant data and generate responses.
Handles communication between the front end and other backend components.
Knowledge Graph (BioKG):
Stores structured biomedical data, including relationships between entities like genes, proteins, and diseases.
Provides the graph-based context for the initial answer.
Graph Context:
The relevant subgraph is extracted from the knowledge graph in response to a user query.
Used to form the initial response, providing context for the generated answer.
OpenAI API:
Extracts additional metadata from the initial graph response, including information about Uniprot IDs, gene info, protein structure (AlphaFold), and drug-related data.
Enhances the initial response with external links and further relevant information.
Metadata Pipeline:
Post-processes the initial graph response using OpenAI.
Enriches the answer with additional biomedical details and links to relevant external resources (e.g., UniProt, AlphaFold, RxNAV).
Enriched Answer Module:
Combines the graph-based answer and additional metadata to provide a more detailed and comprehensive response.
Outputs a final answer with enhanced context and reliability.
In the following sections, we deep dive into each component to provide details of our implementation:
Datasets:
Graph databases are designed to represent data in terms of nodes (entities), edges (relationships between those entities), and properties (additional information on both nodes and edges). Unlike traditional databases that organize data in tables, graph databases focus on the relationships between entities, making them ideal for use cases where connections matter, like social networks, recommendation engines, and knowledge graphs.
Key benefits of graph databases include:
Flexibility: You can easily model complex, interconnected data.
Efficiency: Querying relationships is faster than in traditional databases.
Scalability: Large-scale graphs with millions of nodes and edges can be managed effectively.
In the biomedical domain, we found biomedical datasets and some other frameworks that leverage biomedical datasets for Graph based RAG or similar approaches:
BioKG - A biomedical knowledge graph containing data on a variety of biological data. BioKG uses 13 different reputable data sources allowing for accurate and dependable data.
KRAGEN - RAG framework that integrates multiple biomedical knowledge graphs into a vector database, using advanced prompting techniques like "graph-of-thoughts" to break down complex queries. It reduces hallucinations by retrieving precise biomedical information and providing explainable answers. Users can interact with and visualize the logic behind the answers through a custom graph viewer, ensuring transparency and accuracy.
KGRAG - A Graph RAG framework that leverages the SPOKE biomedical knowledge graph, which integrates data from 19 repositories, including sources like LINCS, GWAS Catalog, ChemBL, and DrugBank. SPOKE models entities such as genes, proteins, drugs, compounds, and diseases, capturing the complex relationships between them. With this interconnected structure, KGRAG retrieves precise biomedical context to provide accurate, contextually rich answers to complex queries.
Why we chose BioKG:
The reason we chose BioKG as our dataset was solely because it contained a larger variety of databases allowing for more accurate responses about the question being asked. When it came to the other datasets they either lacked datasets to use or utilized datasets that were not trustworthy and dependable. For example, when deciding to use KRAGEN we realized that this dataset prided itself more on its question-answering system rather than the data it fed to said question-answering system. In our case, we chose to ignore this dataset since we were more on the lookout for the quality of the underlying data in terms of various entities present in the data rather than the UI of their final product. Then in the case of KGRAG, to use when developing the knowledge graph.
BioKG Dataset Statistics:
When we were looking at BioKG a compelling reason to use it was the fact that it contained 13 different data sources all from unique databases. This allowed us to get our hands on 11 different data files consisting of data related to diseases, drugs, pathways, proteins, cells, and genetic disorders. Each file contained sets of triples ranging from 265 to 2,700,000 entities for us to use when building our knowledge graphs and creating accurate subgraphs.
Here’s a tabular representation of the data provided about the construction of the biomedical knowledge graph (BioKG):
| Category | Details |
|---|---|
| Source Data | Processed over 34 million PubMed abstracts |
| Unique Entities | 10,686,927 unique entities |
| Unique Relations | 30,758,640 unique relations |
| Entity Normalization | Incorporated into the pipeline |
| Relation Extraction Evaluation | Sampled 50 randomly selected PubMed abstracts |
| Performance Comparison | Extraction performance rivals human annotations |
| Total Unique Entities After Integration | 11,479,285 unique entities across 12 types |
| Total Relations After Integration | 42,504,077 relations across 52 types |
| Major Entity Types | Examples: genes, diseases, chemical compounds |
| Major Relation Types | Examples: associations, positive correlation, cotreatment |
| Entity Reference Insights | Diseases are the most common topic with over 20 million articles referencing at least one disease entity |
| Gene Mentions | Often coexist with chemicals and diseases |
| Relation Distribution Insights | Figure 1B depicts the numbers of PubMed abstracts containing one or more of the five major types of relations |
NebulaGraph:
We chose to use Nebula Graph as the graph database to index the BioKG knowledge graph. In ingesting 2,700,000 entities into the graph using serial upserts, one of the roadblocks we faced was the estimated time to complete the upsert (roughly around ~33 hrs) Although this process was a one-time event in our entire pipeline, it was not ideal since we planned on eventually letting developers index their data locally, which with the current efforts was a time-consuming process, not ideal for local development.
Here are some reasons why it was the best choice for our project:
Open-source: Nebula Graph is a completely open-source platform, making it highly accessible and easy to customize for our specific needs.
Performance at scale: Nebula Graph is designed to handle massive graphs with billions of nodes and edges without sacrificing performance.
Distributed architecture: The distributed nature of Nebula allows us to efficiently manage and query large datasets across multiple servers.
Fine-grained schema support: Nebula offers flexible schema management, allowing us to define specific properties on nodes and edges that suit our Knowledge Graph structure.
Rich query language (nGQL): Nebula uses nGQL (Nebula Graph Query Language), which is easy to learn and powerful, allowing us to query the relationships between entities quickly.
Multiprocessing:
To solve our time conflict when upserting entities into NebulaGraph, we used multiprocessing (Fig.3) . It is the process of dividing a series of tasks appropriately in order to solve time constraints. By using this we were able to parallelize the indexing of all the triples of BioKG, This significantly cut down the time needed to upsert the entities to the knowledge graph for the BioKG dataset from 33 hours to 3 hours allowing us to deploy our product with less worry of the consumer having to wait for hours on end.
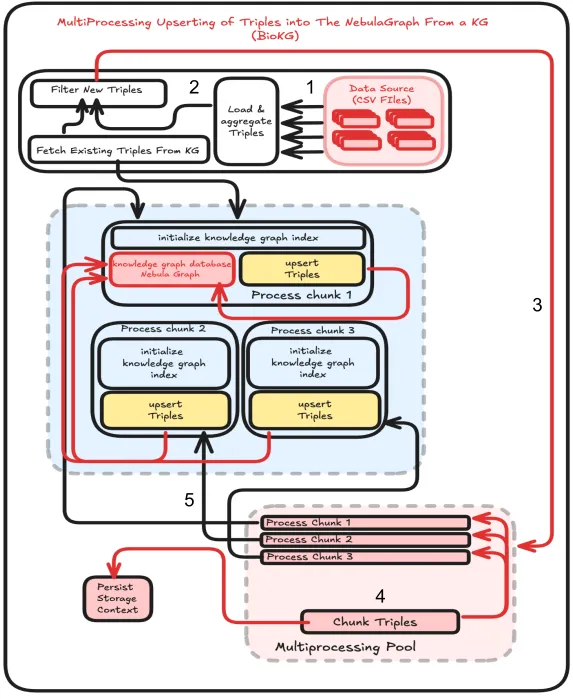 Fig.3 Multiprocessing System
ML Algorithm
Graph RAG (Graph-based Retrieval-Augmented Generation) enhances the standard RAG (Retrieval-Augmented Generation) framework by using a graph database, such as Nebula Graph, to better represent relationships between entities. This graph-based retrieval mechanism generates more accurate responses by considering the links and properties among entities. Consequently, Graph RAG improves both the precision of retrieval and the quality of the generated content by providing richer, more structured data to the model.
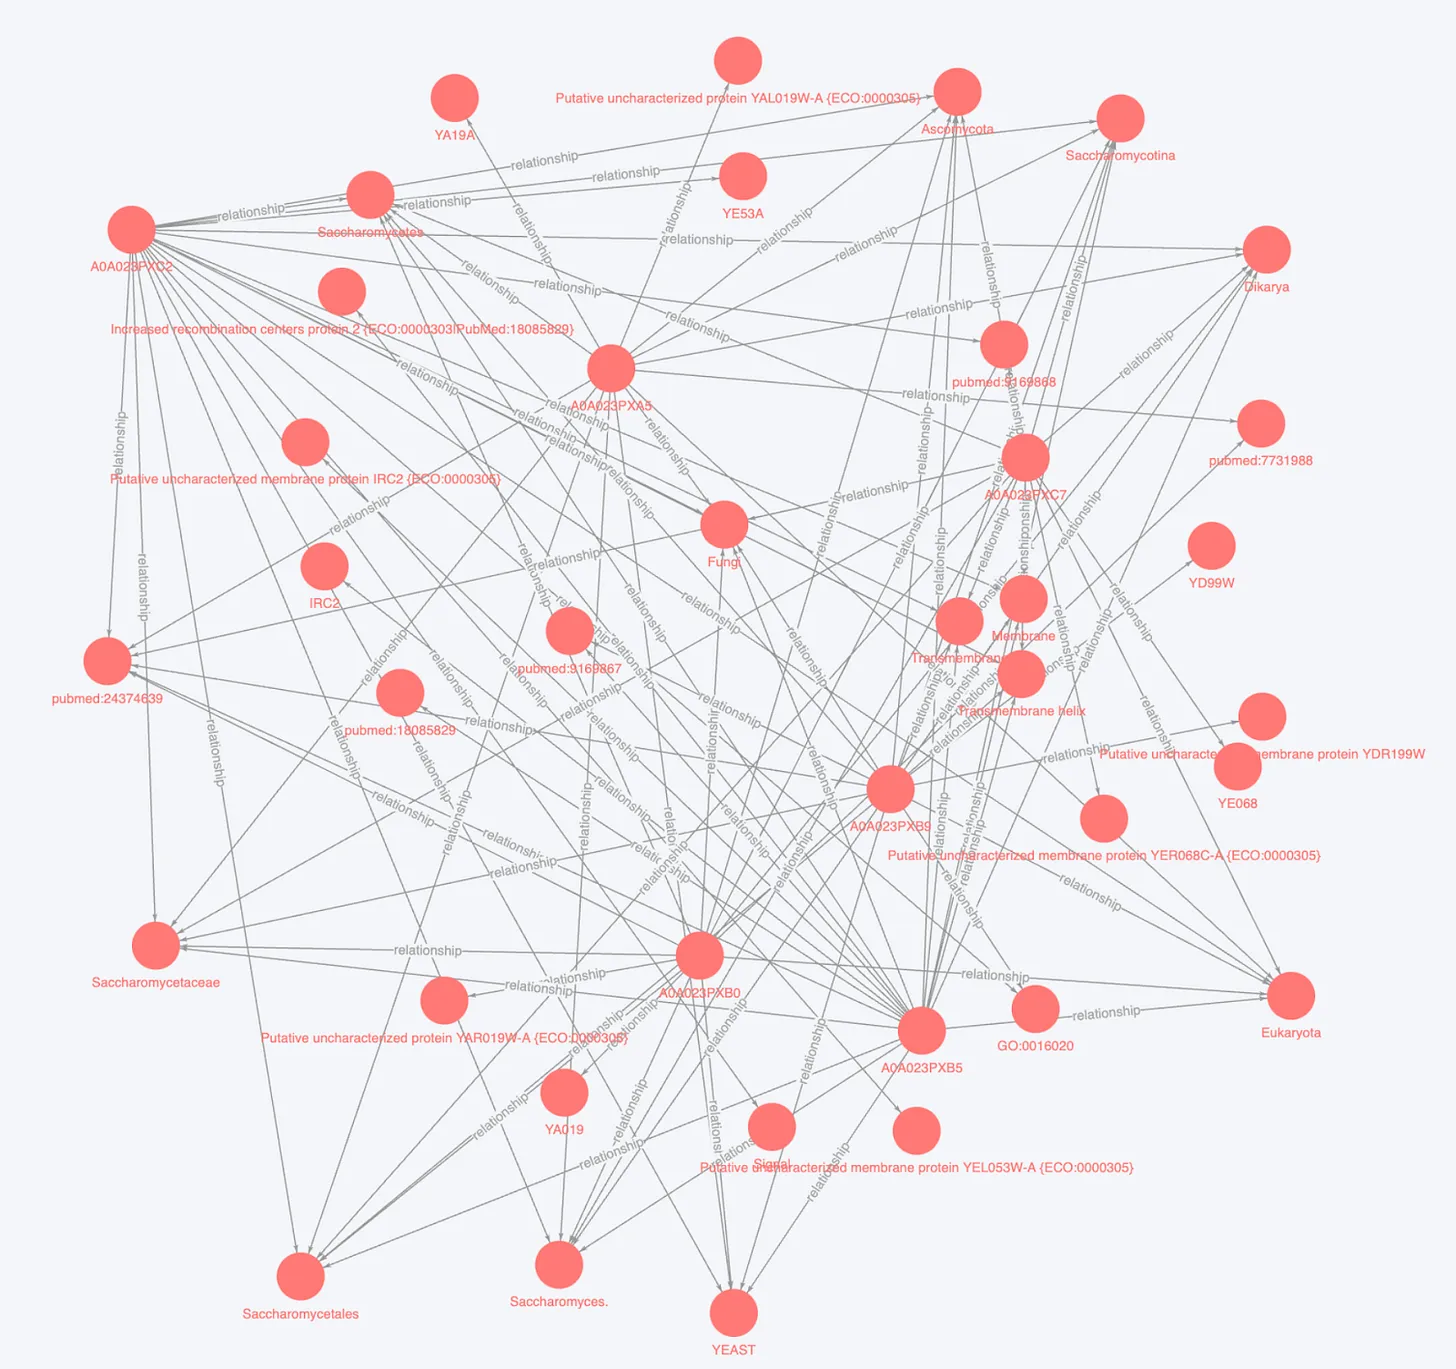
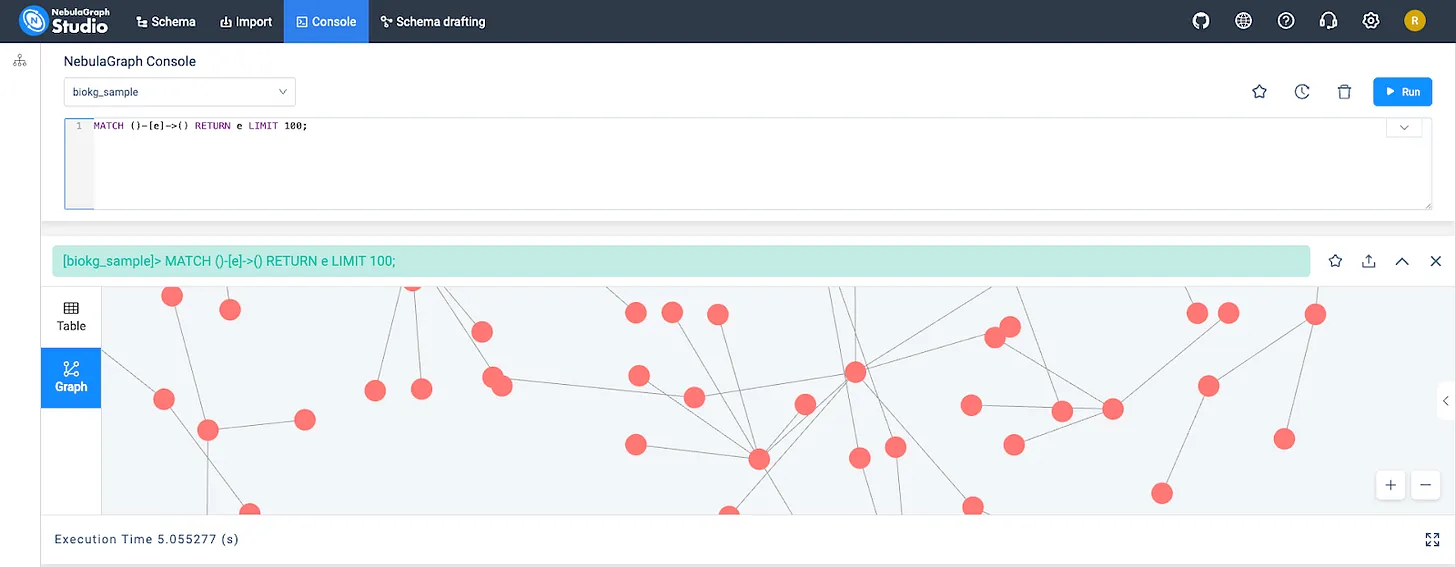
Fig.4 100 entities with relationships from BioKG
Introduction to LlamaIndex for Creating the Index
LlamaIndex (formerly known as GPT Index) is a tool that facilitates indexing and retrieving data using large language models. For our Graph based RAG system, LlamaIndex plays the key role of creating an index for our Knowledge Graph, built-in Nebula Graph. Instead of just looking up unstructured text, LlamaIndex allows us to index the entities and their relationships, making it easier to retrieve the most relevant information.
The main steps LlamaIndex helps with include:
Indexing the Knowledge Graph: LlamaIndex creates a structured index of the entities, relationships, and properties in our Knowledge Graph. This enables faster and more precise retrieval of data.
Retrieval and Querying: When a user query comes in, LlamaIndex uses the indexed graph to retrieve the most relevant triplets (entity-relationship-entity sets), which are then passed to the LLM for answer generation.
How to Retrieve Relevant Triples Given a User Query
In a Graph based RAG system, once the index is built using LlamaIndex and the data is stored in Nebula Graph, the retrieval process is straightforward. Here’s how it works:
User Query: A user inputs a natural language question, for example, "What relationship exists between mitochondria and energy production?"
Index Querying: LlamaIndex queries the Nebula Graph to retrieve relevant triples (such as “mitochondria -> generates -> ATP”), based on the query.
Retrieval of Triples: BioGraphRAG retrieves triples that contain entities and relationships related to the user’s query.
Answer Generation: The retrieved triples are passed to the LLM, which then generates a coherent, contextual answer for the user.
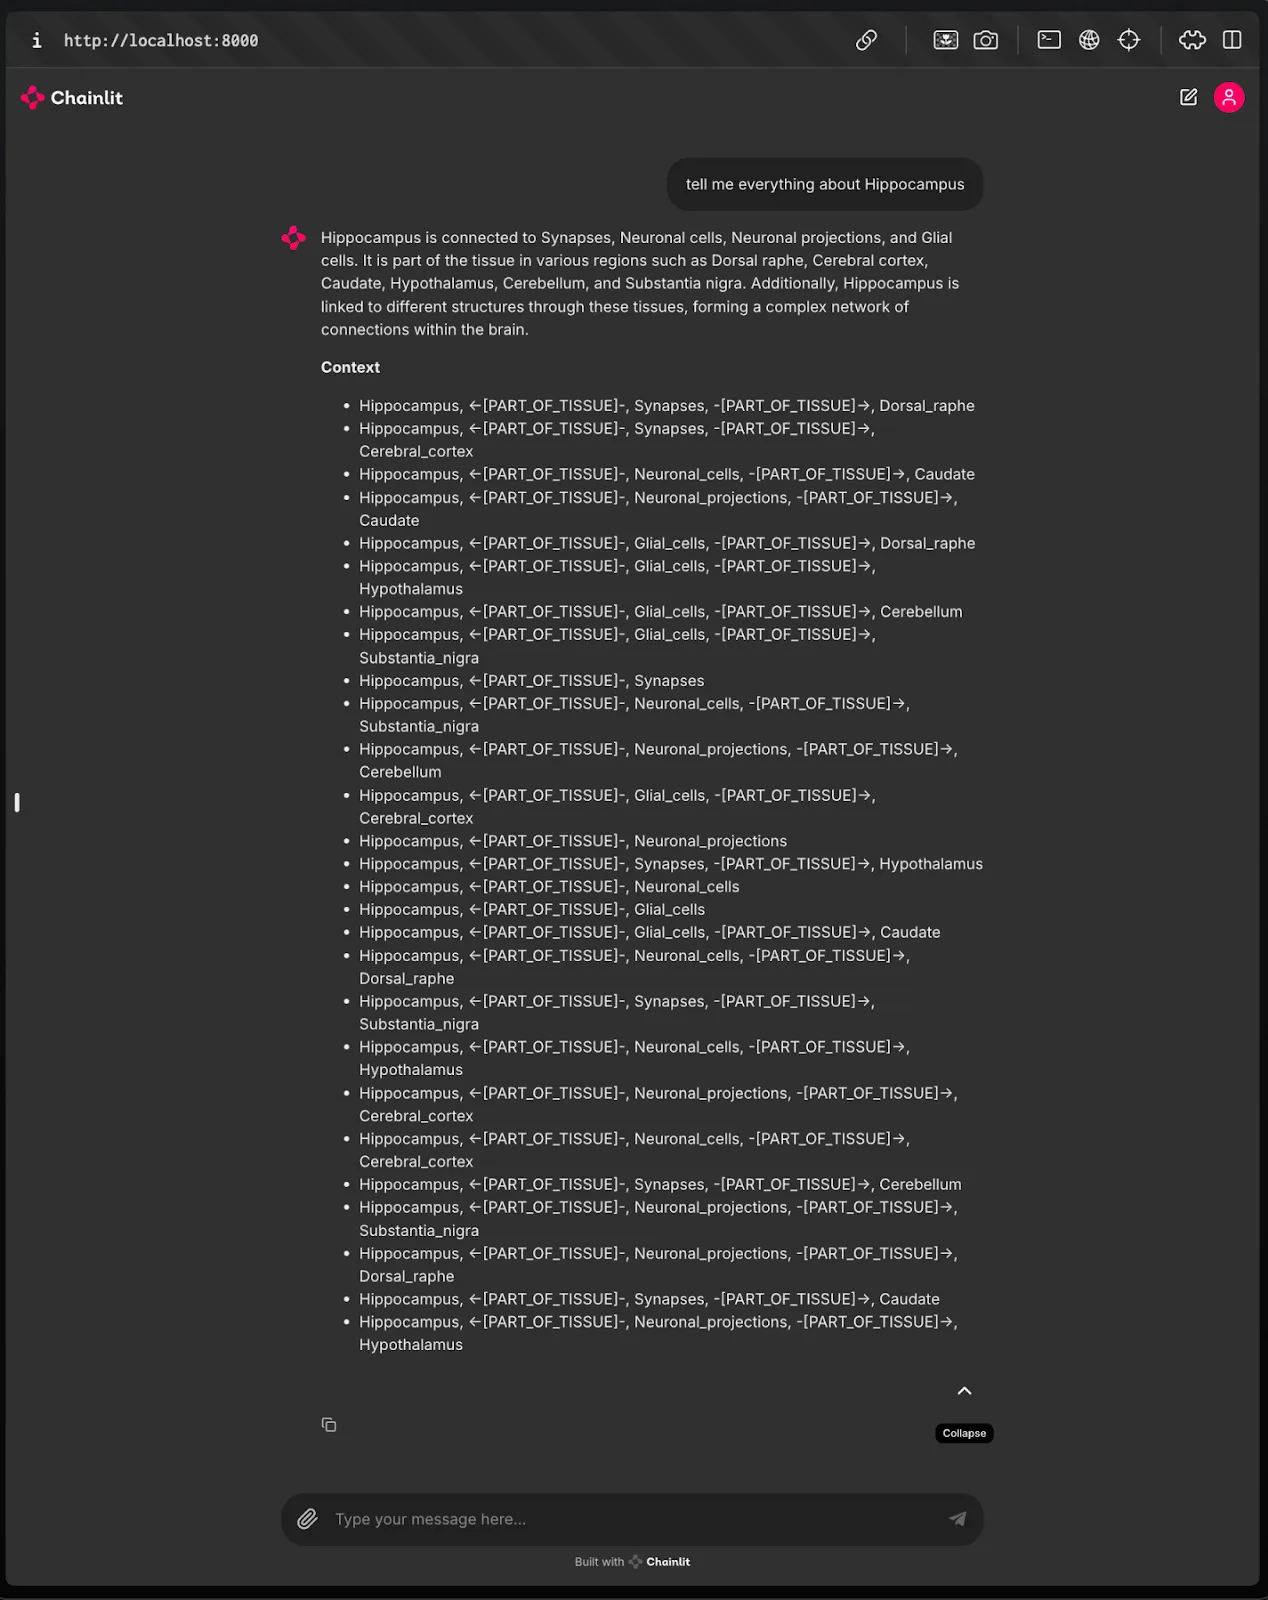
Sample Query and Outputs
Let’s look at a sample query and the corresponding output from our Graph based RAG system (Fig.5):
User Query: “How do Macrophages relate to Endometrium?”
- Query to NebulaGraph:
MATCH (entity1:process)-[rel:relationship]->(entity2:component)
WHERE entity1.name = 'photosynthesis'
RETURN entity1, rel, entity2;
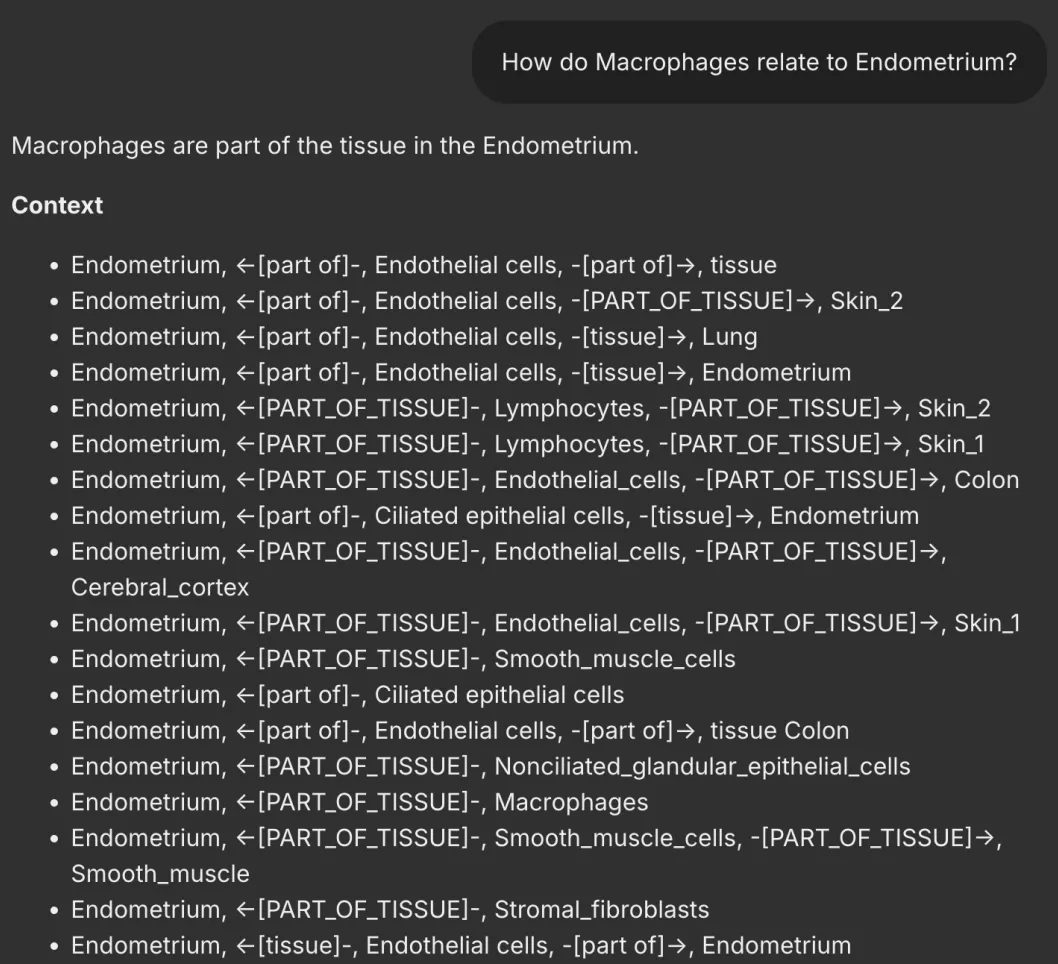
Fig.5
- Output: BioGraphRAG may return triples like:
photosynthesis -> involves -> light reaction
photosynthesis -> produces -> oxygen
photosynthesis -> uses -> chlorophyll
This data is then fed into the LLM to generate a final response like: “Photosynthesis involves the light reaction, uses chlorophyll, and produces oxygen as a by-product.” This combination of graph database retrieval and LLM generation gives us a rich and accurate answer, ensuring that the relationships between concepts are well represented.
User Interface
Chainlit is an open-source tool designed for building conversational AI applications efficiently. It enables developers to integrate machine learning models and implement human-in-the-loop (HITL) systems, streamlining the creation of AI-driven conversations for various applications like customer service and personal assistants.
We chose Chainlit for its developer-friendly interface and robust features that enhance both developer and user experiences. Its rapid prototyping capabilities and seamless integration with popular ML frameworks made it an ideal choice.
Key Features:
Seamless ML Integration: Connects easily with state-of-the-art AI models.
Human-in-the-Loop Capabilities: Collects real-time user feedback to improve model performance.
Customizable UI: Allows developers to tailor the interface to specific needs.
Enhancements for Building Conversational Agents
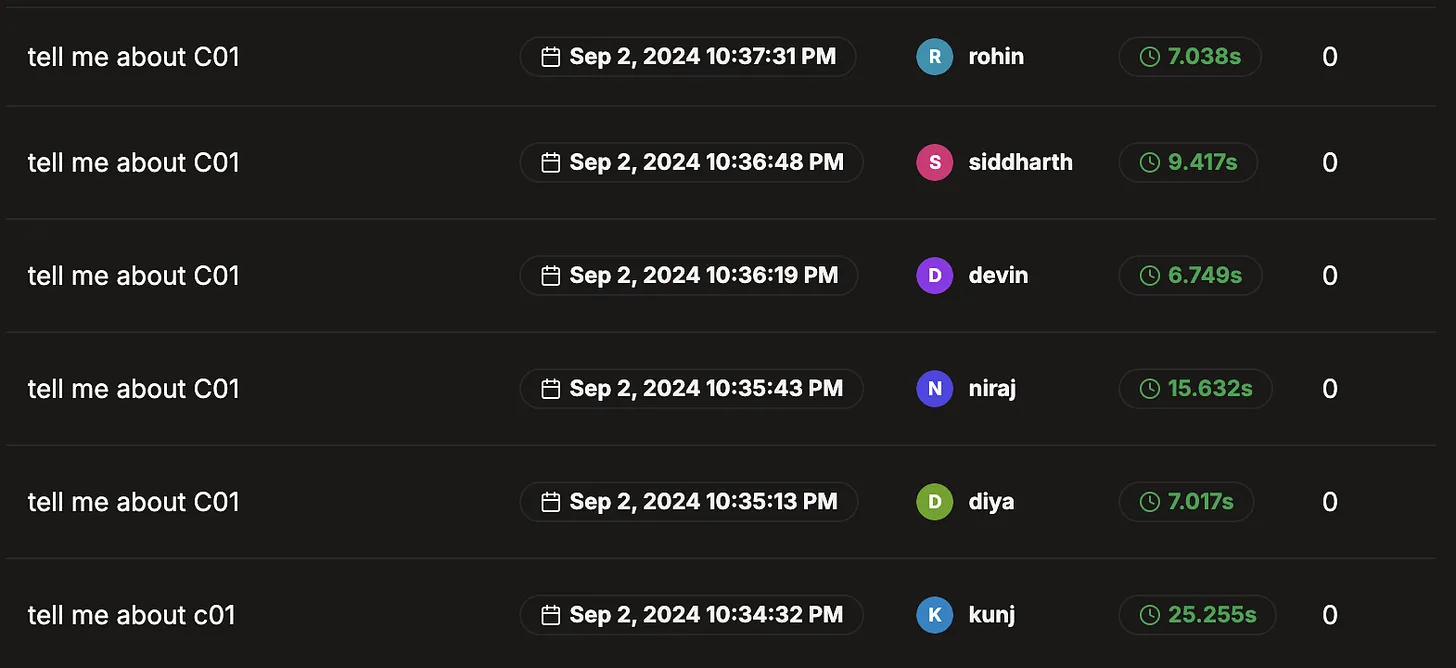
Fig. 6 View of Literal API
Chat Threads: Organizes conversations into threads for easy tracking, debugging, and analysis of user interactions.
AI Feedback Collection: Captures user insights during conversations to refine the AI's responses.
Literal AI Dashboard: Provides a real-time overview of conversations, tracking user engagement and AI performance.
Contextual Graph Visualization: Displays conversation context as a graph, improving transparency in decision-making.
Easy Prototyping: Intuitive interface and templates enable quick creation and testing of conversational agents.
Continuous Improvement
Chainlit's feedback loop allows developers to gather user insights in real-time, enhancing the AI's accuracy and relevance by identifying conversational shortcomings. This ensures the AI model evolves through user engagement.
Supporting Graph-Based Answer Generation
To enhance graph-based answer generation, Chainlit will require:
Graph Data Integration: Ability to pull data from knowledge graphs.
Graph Traversal Logic: Logic to navigate graphs and deliver relevant information.
Answer Context Mapping: Capability to translate graph data into coherent natural language responses.
Visualizing Context
Chainlit can also display conversational context as a graph, providing:
- Node-Based Interactions: Each user input is a node, with AI responses represented by edges.
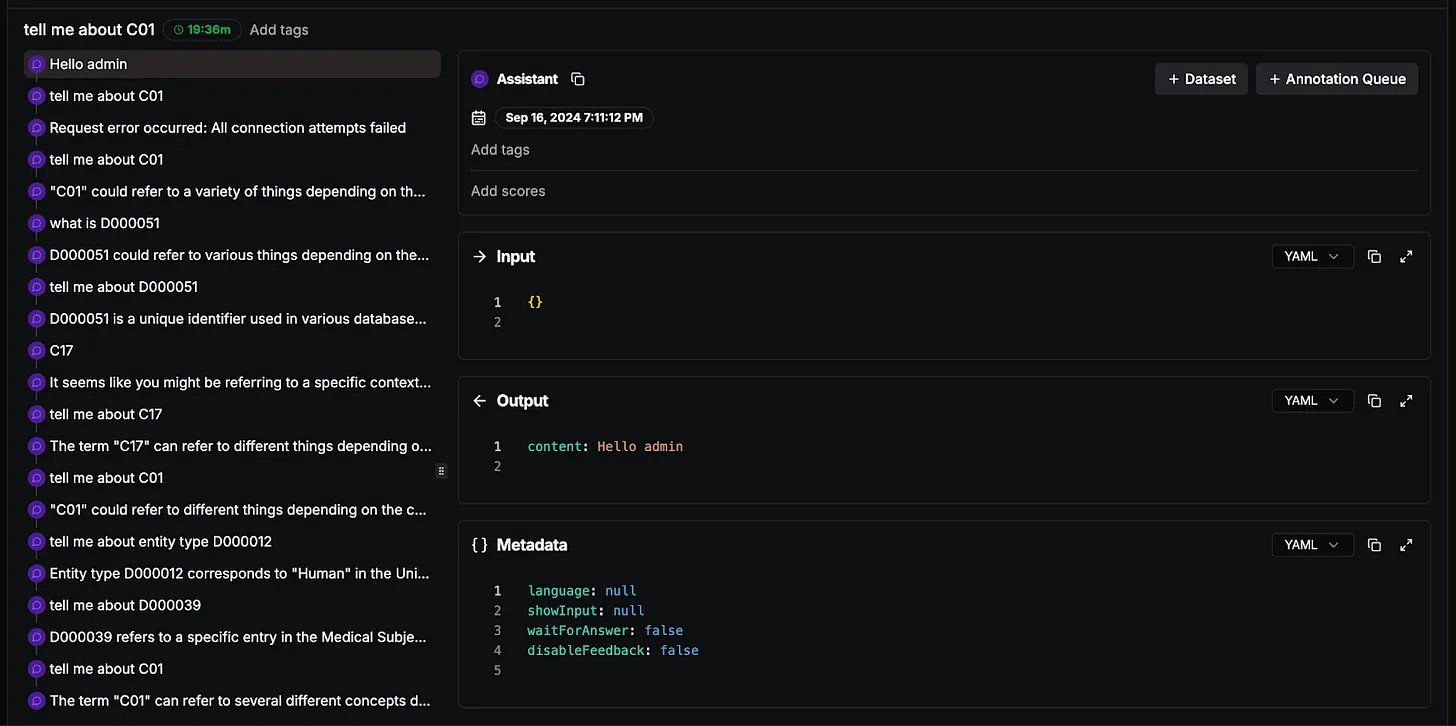
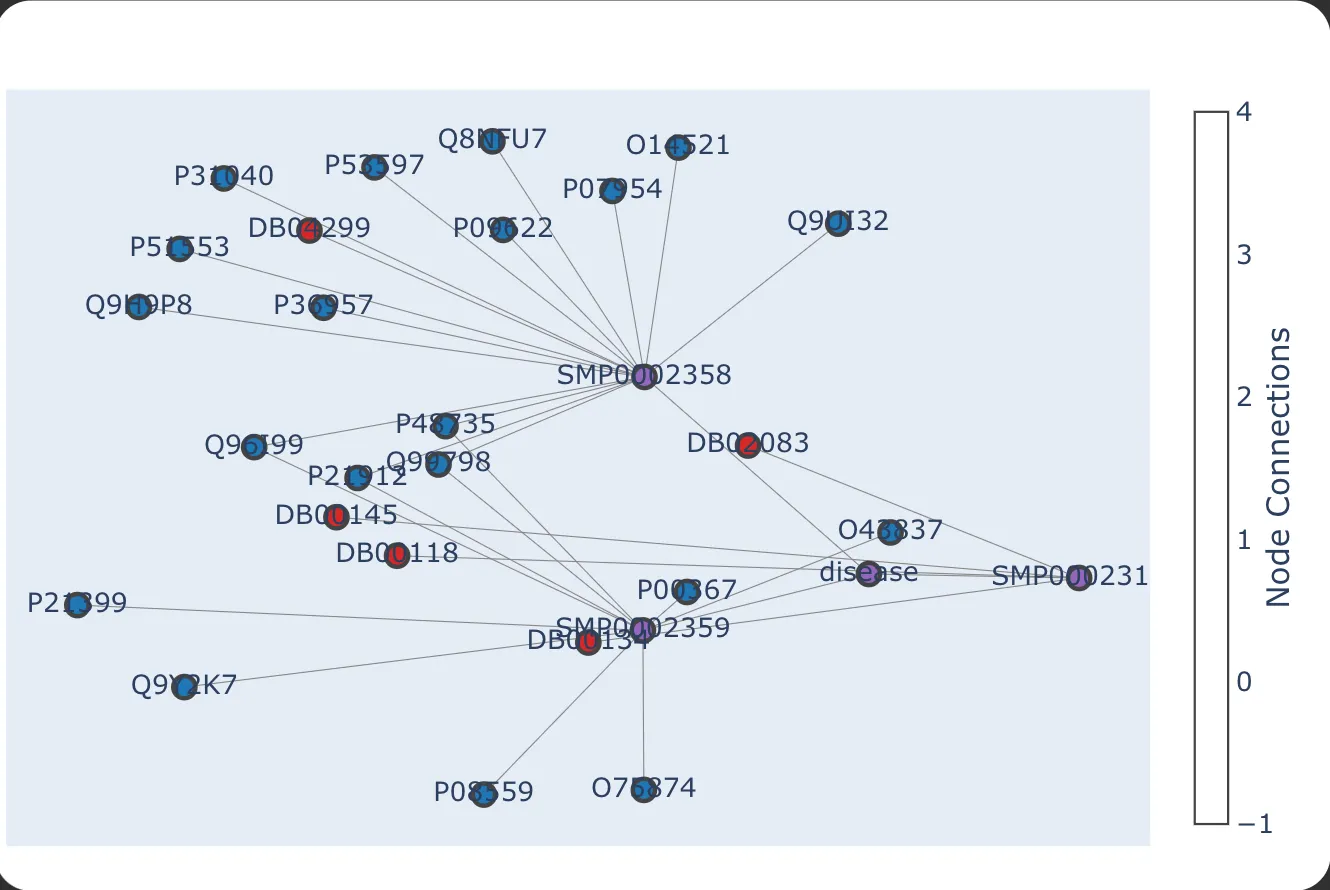 Fig.8 Nebula graph view in UI
User-Friendly Interface: Visualization enhances user understanding of AI decision-making.
Debugging and Transparency: Developers can easily track conversation evolution and troubleshoot issues.
Enriching Answers: Beyond the Basics of Knowledge Graph RAG
While using Graph RAG with BioKG produces answers, they are often brief—typically just a couple of lines. To enhance user experience, it became essential to provide additional context, such as definitions and useful URLs for genes, proteins, and drugs, thus enriching the responses and making them more valuable to users.
By leveraging UniProt for detailed gene information, AlphaFold for protein structure insights, and RXNav for comprehensive drug data, we transform brief, basic responses into rich, contextual answers. This multi-faceted approach ensures that users receive not just accurate information, but a thorough understanding of complex biomedical topics.
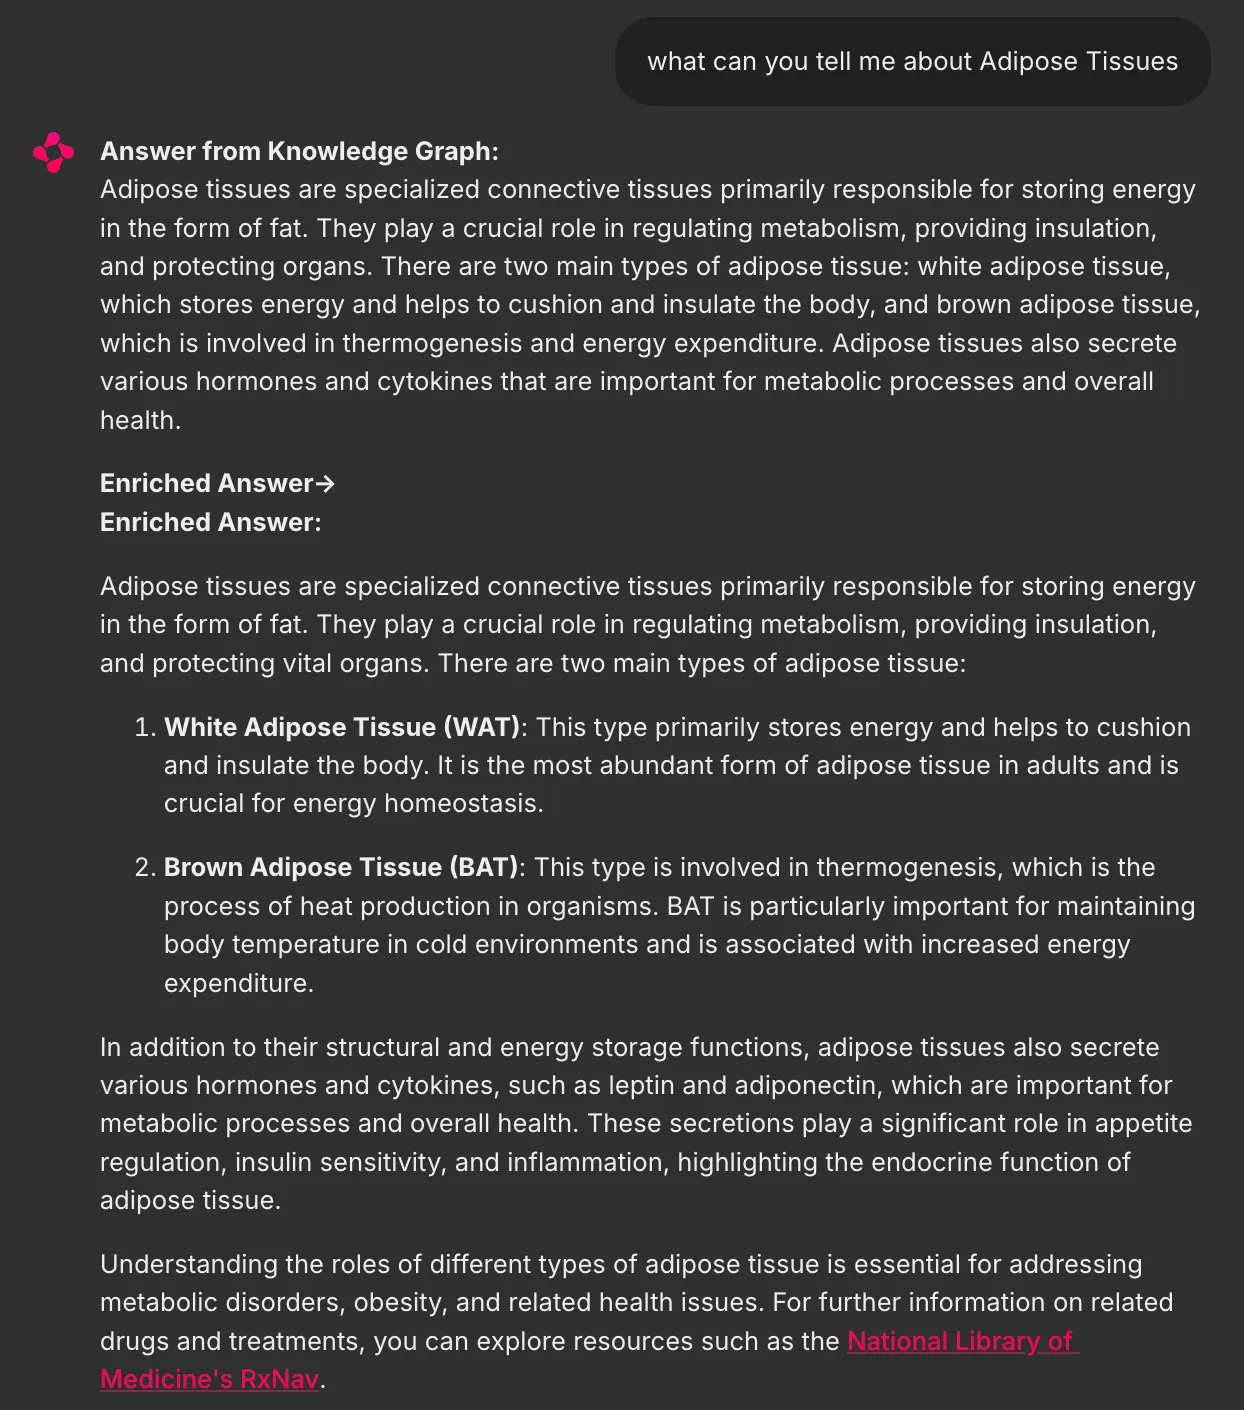
Fig.9 The Imperative for Enrichment
To truly serve the needs of biomedical professionals and researchers, we must go beyond basic graph retrieval. Answer enrichment is not just an enhancement; it's a necessity. By integrating data from specialized databases like UniProt, AlphaFold, and RXNav, we transform our system from a simple query-response tool into a comprehensive knowledge platform.
In the following sections, we'll explore how this integration process works and the dramatic improvement it brings to the quality and usefulness of our answers. Whether you're researching a specific gene, exploring protein structures, or investigating drug interactions, our enriched answers provide the depth of information you need.
How Do We Augment the Answers Generated from the Graph-RAG Model?
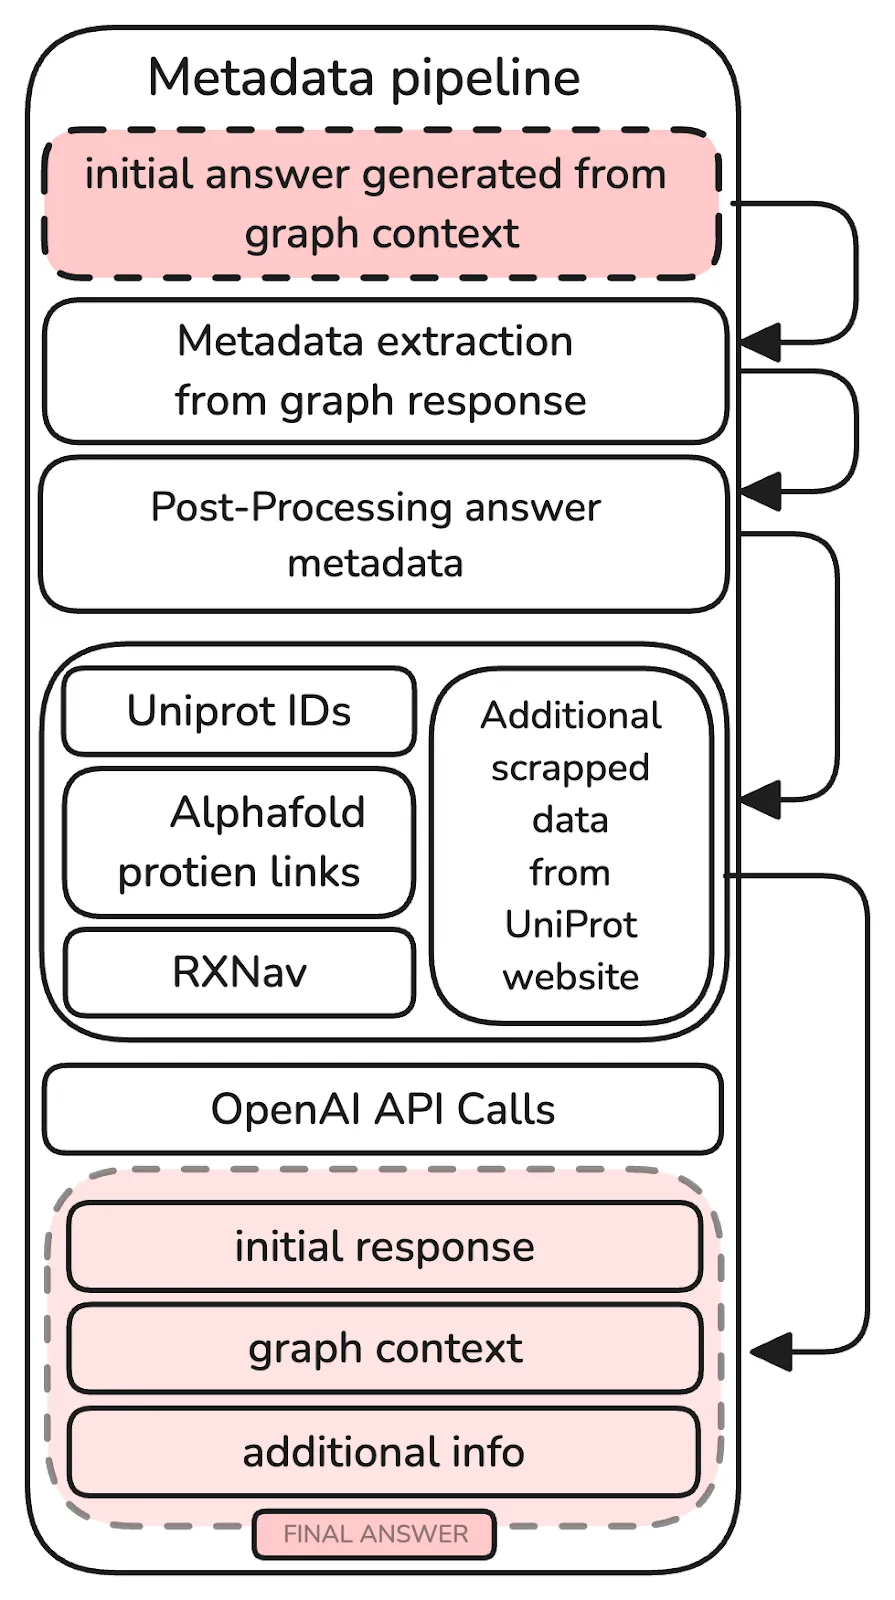
Fig.10 This figure illustrates the system architecture, highlighting the enrichment pipeline.
Multi-Stage Pipeline Execution
- Graph Query Execution
The pipeline begins by querying the BioKG using a specialized query engine called kg_index_query_engine.
This step retrieves the initial answer along with a subgraph representing the context and relationships between entities related to the question.
- Graph Response Processing
The response from the graph query is processed to extract key components such as the context, initial answer, and subgraph.
This involves parsing the response and extracting triples that represent the relationships in the subgraph.
- Answer Enrichment
The initial answer is enriched by invoking additional modules that query specific metadata sources.
These include gene-related information, protein structures via AlphaFold, and drug-related data.
The enrichment process merges this additional information with the initial answer to create a more comprehensive response.
- Final Response Composition
The final response is prepared by integrating the initial answer, enriched content, and metadata.
This response includes all relevant information in a structured format, ensuring it is both comprehensive and contextually accurate.
Links to relevant external resources are included when available.
- Fallback Mechanism
If the graph query fails (e.g., no relevant subgraph is found), BioGraphRAG automatically falls back to a general query approach using an OpenAI-powered LLM.
This ensures robustness when the knowledge graph does not provide sufficient coverage.
- Logging and Error Handling
Extensive logging is included at each stage, particularly during graph querying and answer enrichment.
This is crucial for debugging, performance monitoring, and ensuring each component functions as expected.
Error handling mechanisms catch and report issues without disrupting the overall process.
To ensure a seamless user experience, our system is designed to fall back to Large Language Models (LLMs) when a query is not present in the knowledge graph. This capability is made possible by our effective prompts, specifically crafted for the biomedical domain, which are integrated into the system's backend. If the graph query fails to retrieve relevant information, our system automatically triggers the LLM fallback mechanism, leveraging the power of advanced language models to generate accurate and up-to-date responses. This approach guarantees that users receive the latest information related to their biomedical queries, even if it's not present in the graph, thereby providing a comprehensive and satisfying experience.
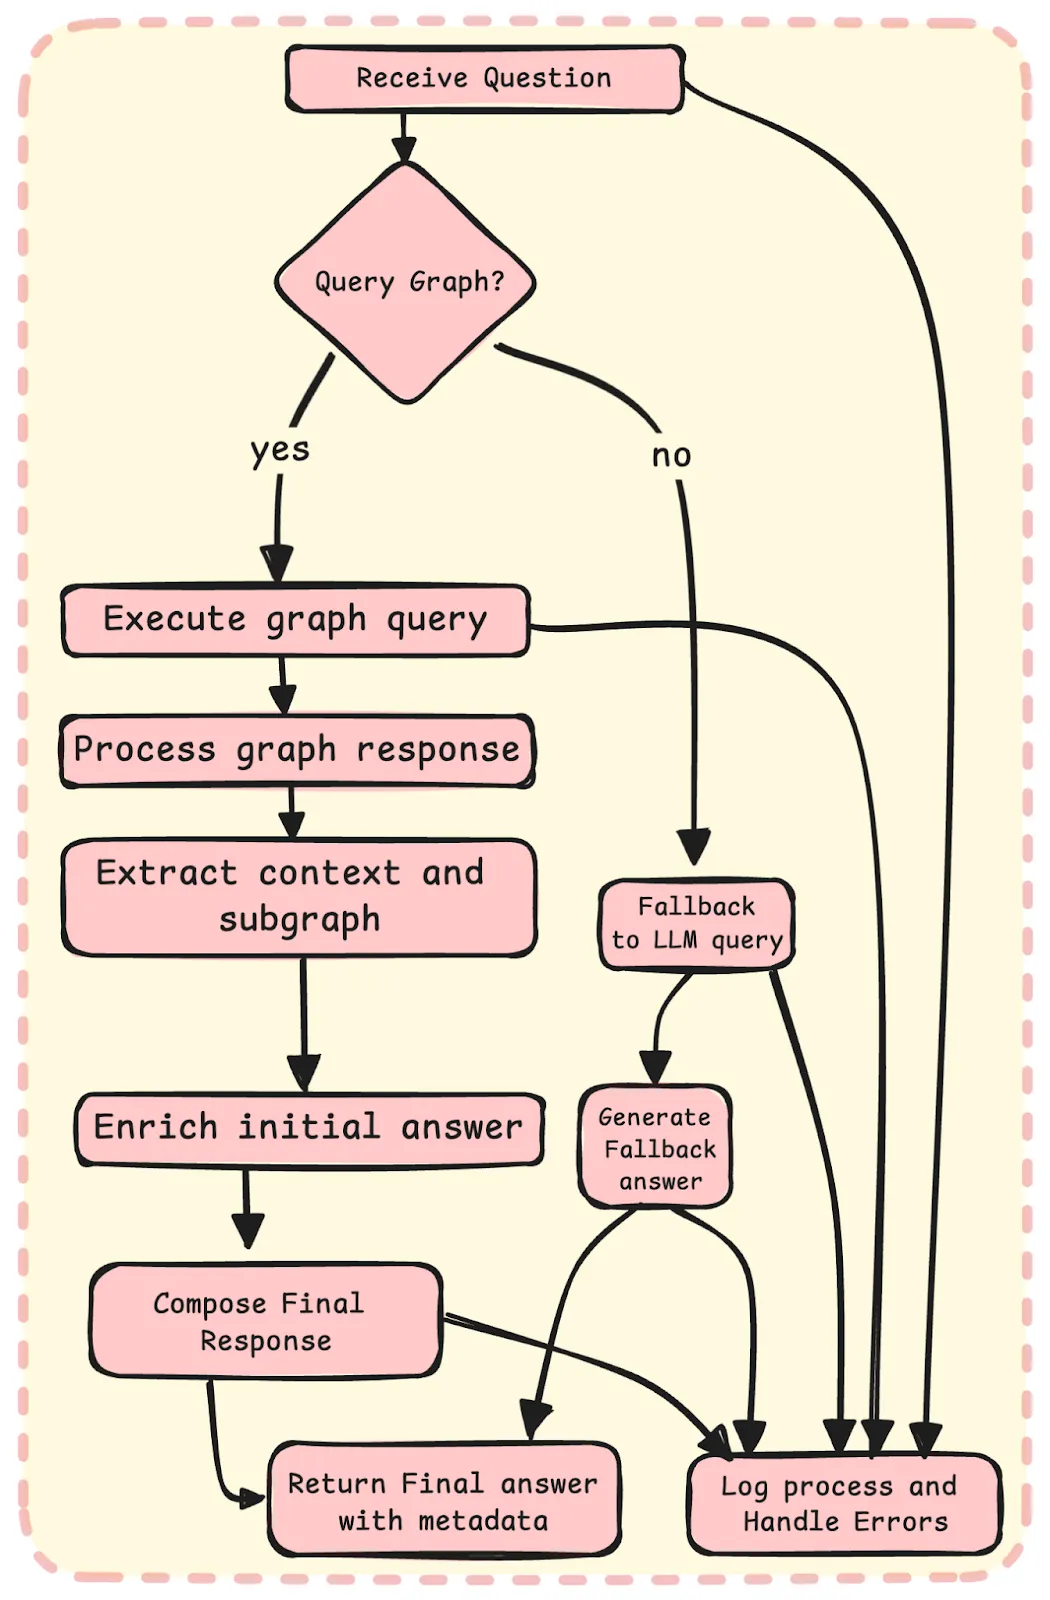
Fig.11 Answer Enrichment Pipeline
Fig.12 Before Enrichment:
The initial answer generated from the BioKG query provides basic information relevant to the user's question, primarily focusing on direct relationships extracted from the subgraph.
Fig.13 After Enrichment:
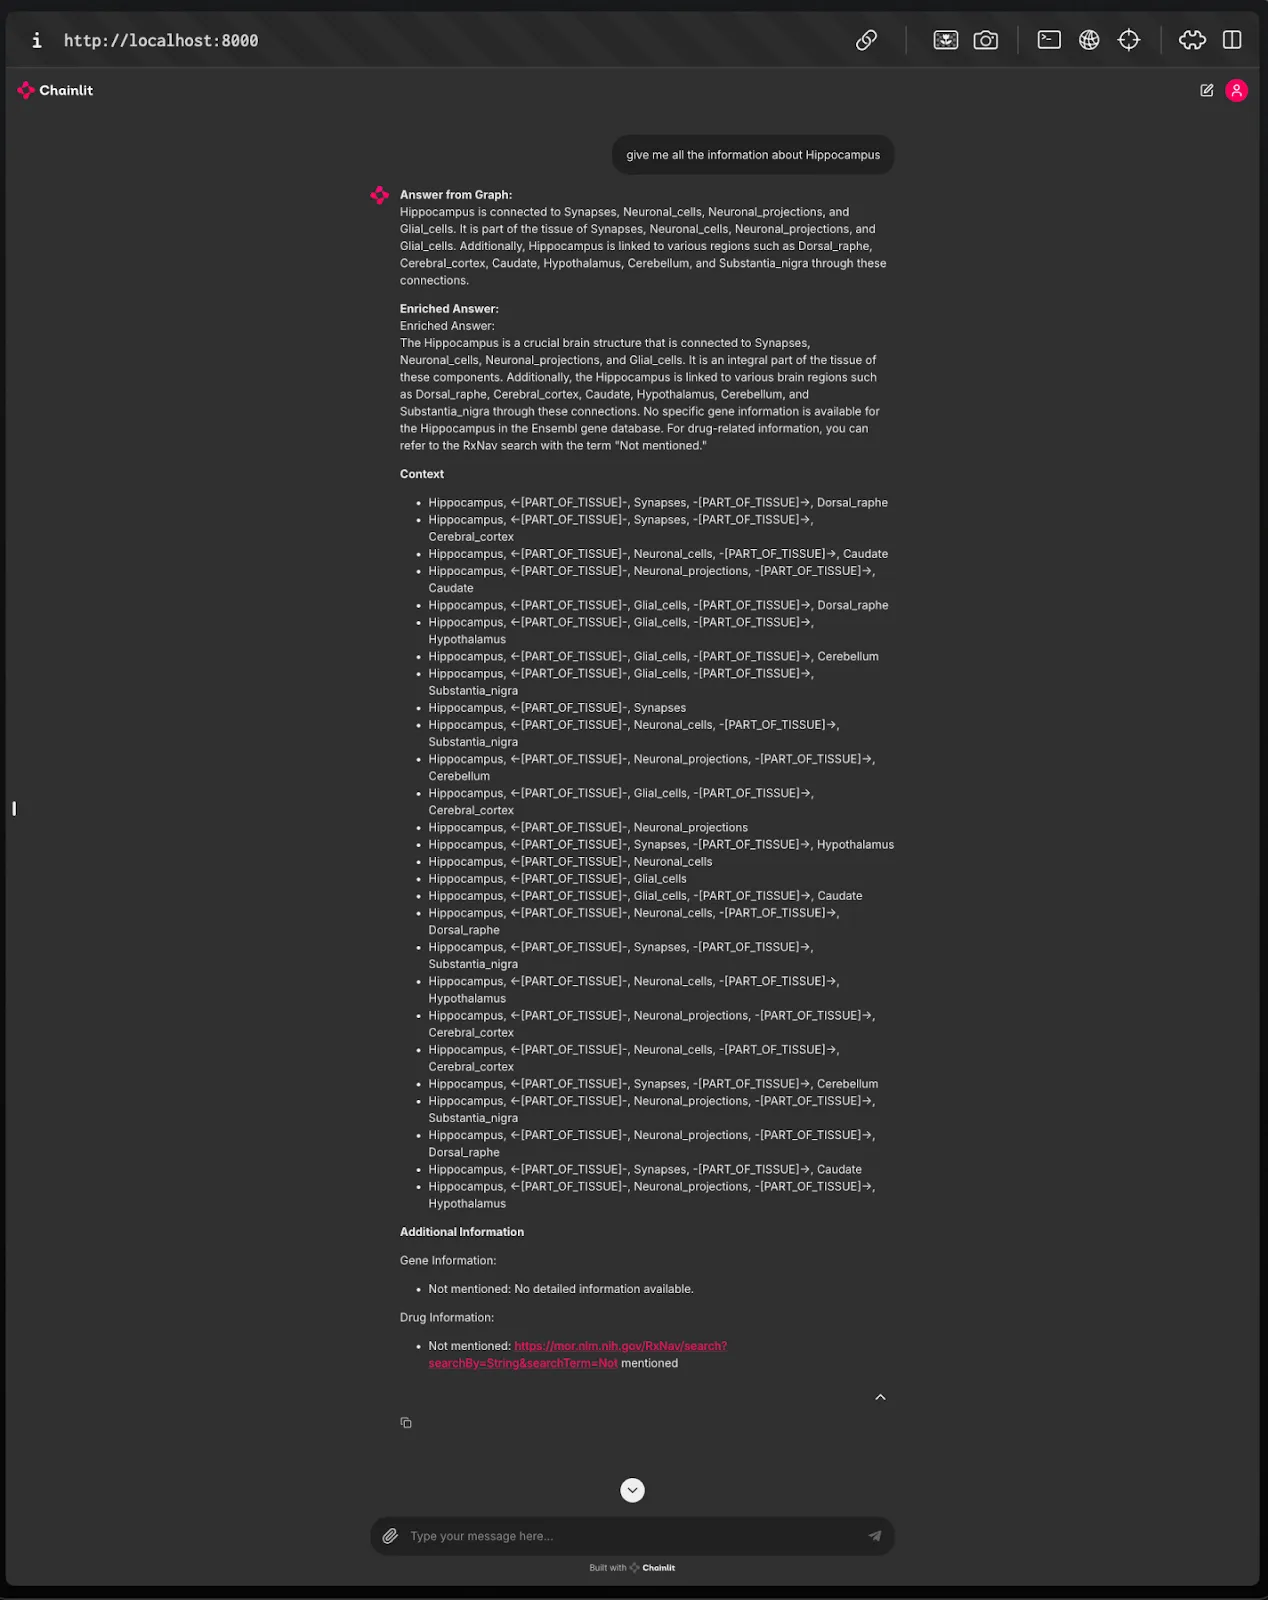
The enriched answer includes additional contextual information from external metadata sources, offering a more comprehensive and detailed response
Analysis of Node Degree and Its Impact on Query Response Time
The Graph RAG system encountered performance challenges due to the overwhelming volume of triplets retrieved during queries. These triplets, which represent the relationships between entities in the knowledge graph, became particularly problematic when queries involved nodes with a high degree of connectivity. As these nodes often hold numerous connections, the system struggled to efficiently process and return results, leading to extended response times and strained resources. This issue raised concerns about BioGraphRAG’s ability to handle complex, large-scale queries, especially in applications involving large datasets with high node degrees in BioKG.
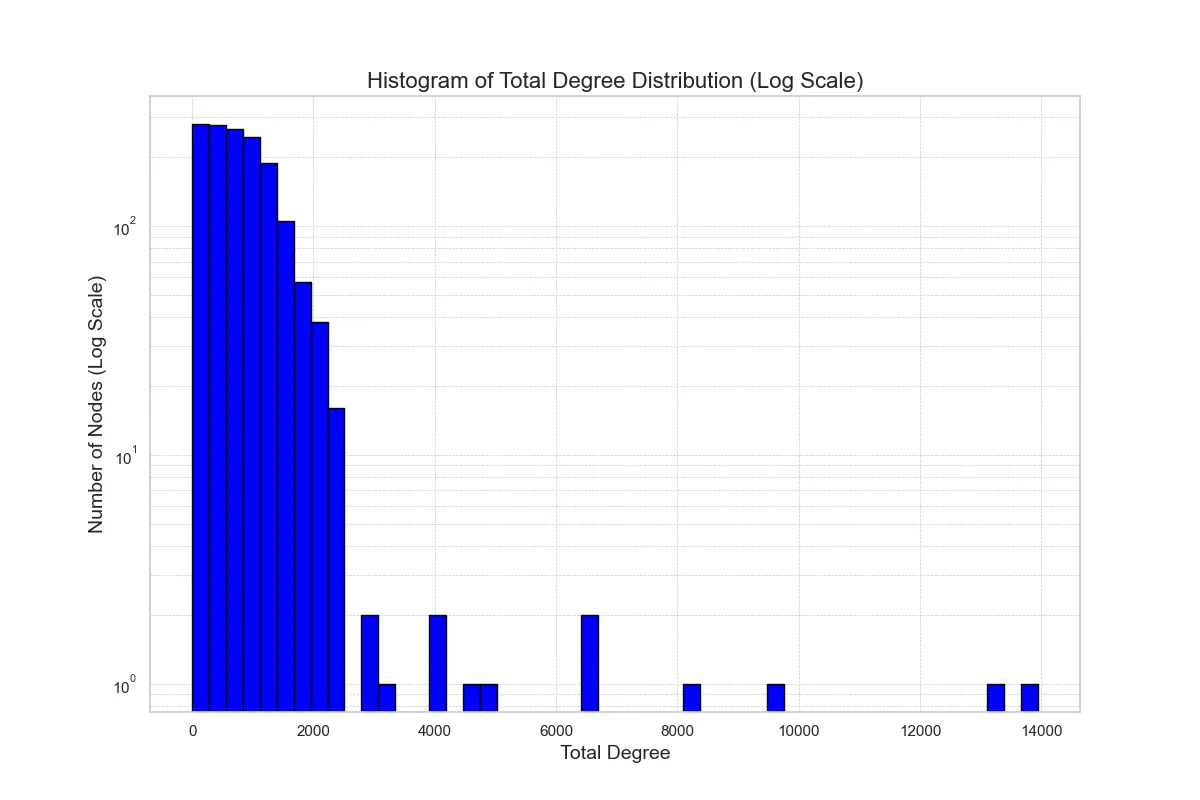
Fig. 14 Total Degree Distribution of BioKG Nodes
To address these concerns, we conducted an analysis of the node degree distribution within BioKG to understand how the degree of a node impacts query latency. Specifically, we examined the in-degree (incoming connections) and out-degree (outgoing connections) distributions to identify patterns and bottlenecks in the system. These distributions revealed a scale-free topology, commonly found in biological networks, where a small subset of nodes (high-degree nodes) hold a disproportionate number of connections. By visualizing these distributions, we aimed to diagnose the source of the performance issues and explore potential optimization strategies to improve the system's ability to handle high-volume queries.
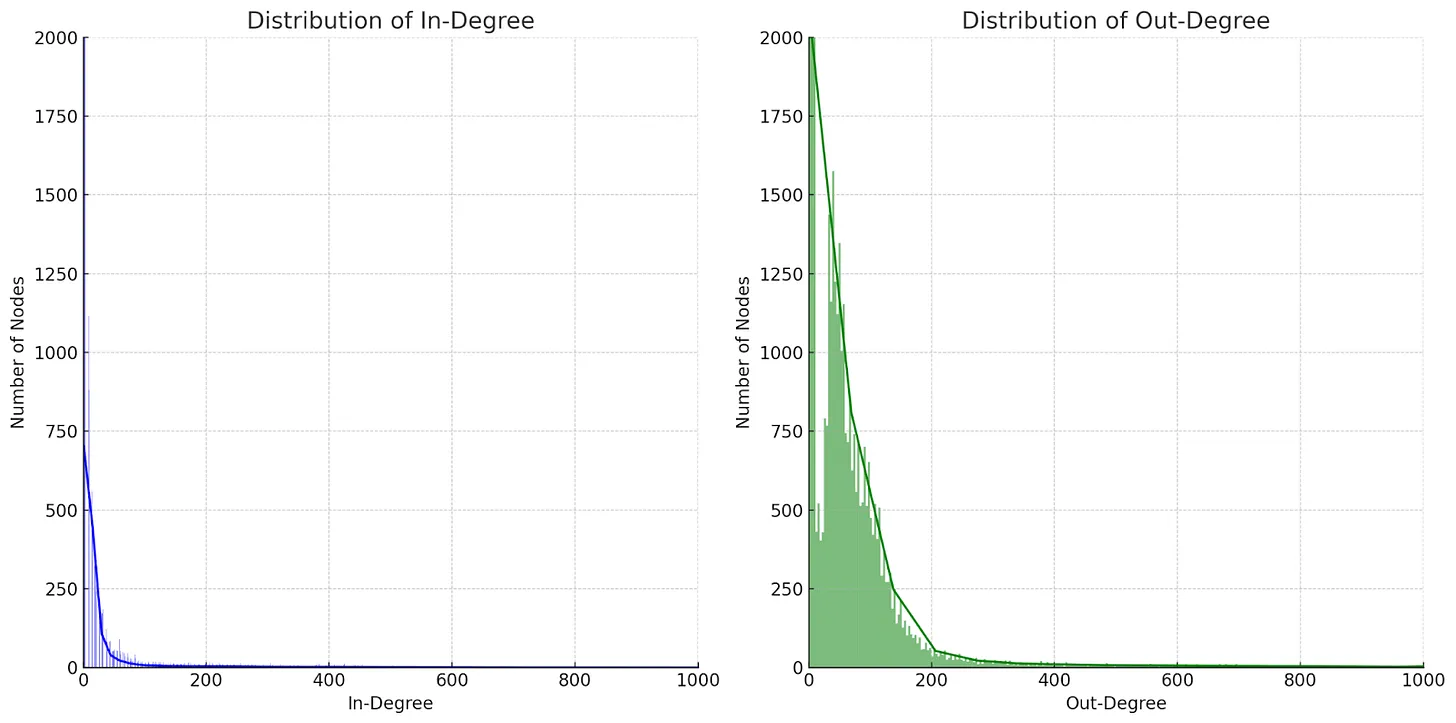
Fig. 15 In Degree and In Degree Distribution of BioKG Nodes
Analysis of Node Performance Based on Degree
In this technical analysis, we explore the performance metrics of nodes categorized into low, mid, and high-degree groups. Each group is analyzed based on several performance factors, including retrieval time, generation time, enrichment time, and total time.
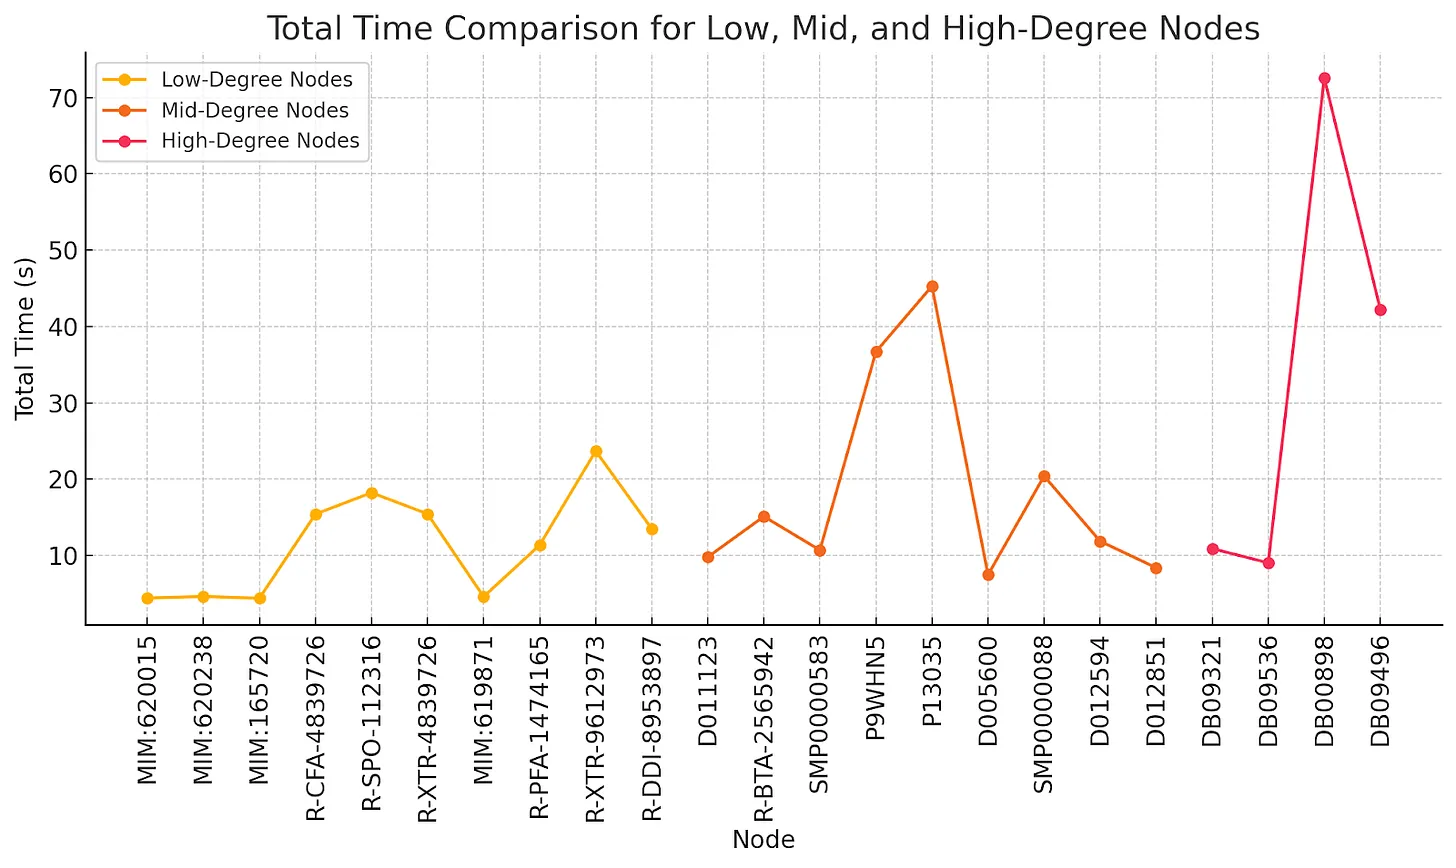
Fig. 16 Low-Mid-High Degree Node Total Time Comparison
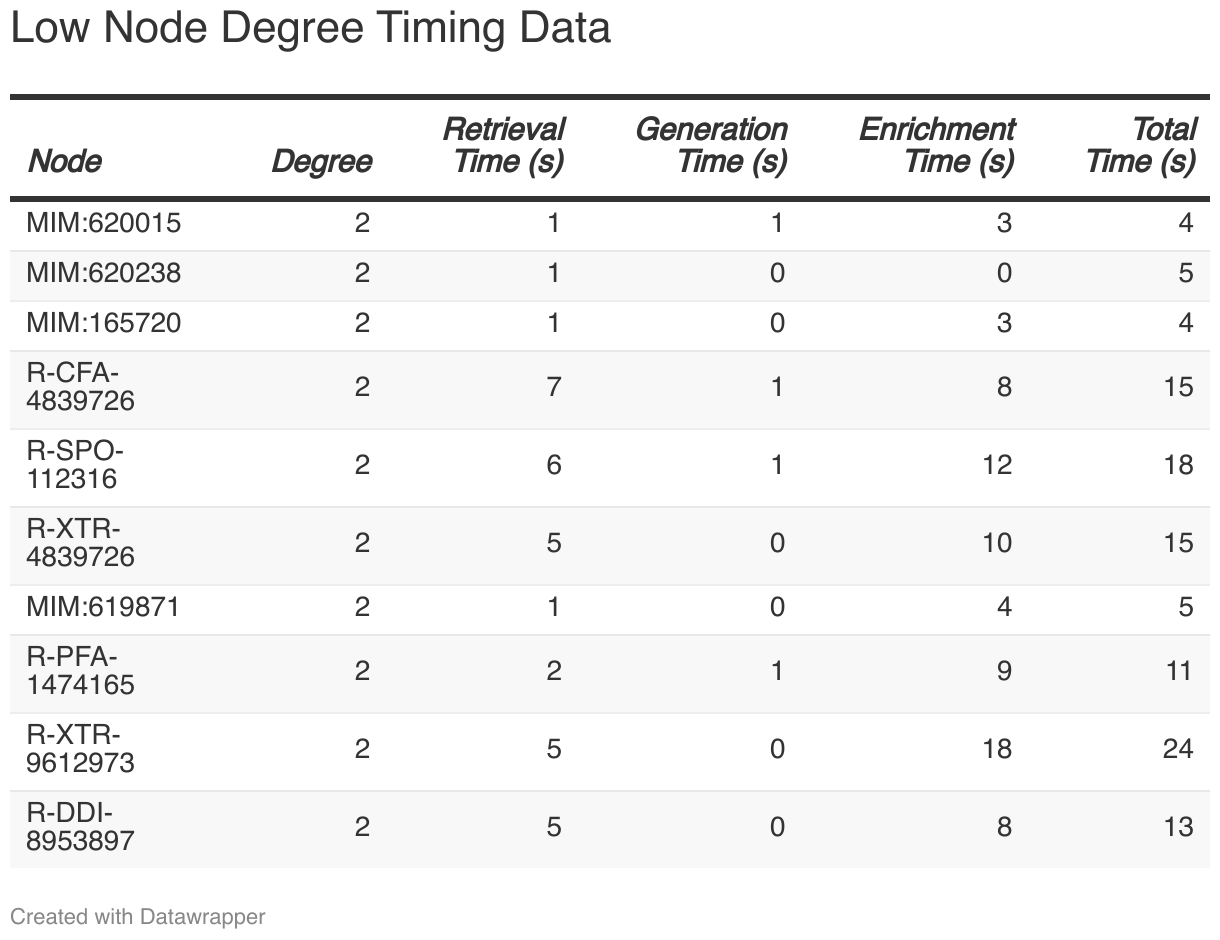
Low-degree nodes represent relatively simple structures, and their performance data is as follows:
The retrieval times for nodes in this group ranged from 0.93 seconds to 7.29 seconds, with an average of approximately 3.59 seconds. Generation times, on the other hand, showed minimal variation, staying between 0.01 milliseconds and 0.62 milliseconds. In contrast, enrichment times demonstrated significant variability, spanning from 3215.20 milliseconds to 18388.91 milliseconds, indicating that some nodes undergo a considerably longer enrichment process. As a result, the total processing time for nodes in this group ranged from 4.39 seconds to 23.68 seconds, revealing that certain nodes can experience substantial delays.
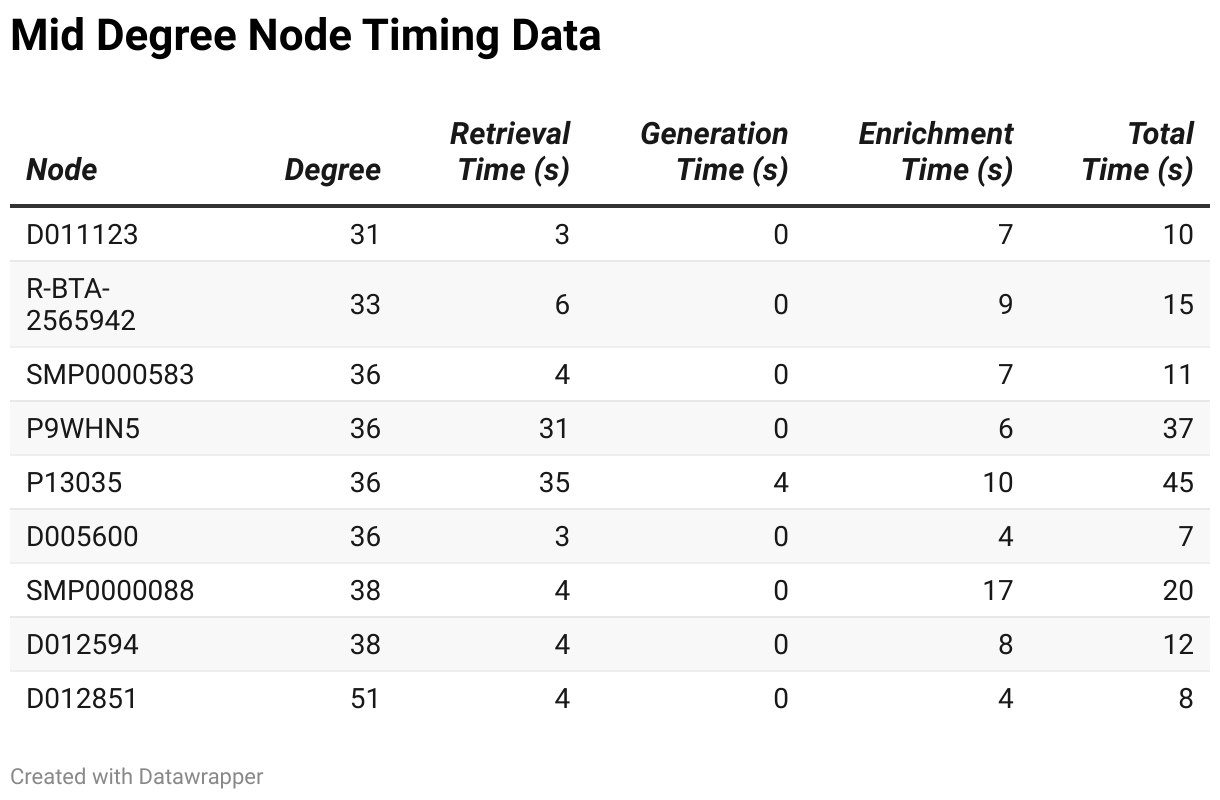
Nodes in the mid-degree range exhibit more complexity, which is reflected in their performance metrics:
Retrieval times for mid-degree nodes ranged from 3.17 seconds to 35.35 seconds, showing a considerable variation, with some nodes requiring significantly longer to retrieve. Generation times were relatively small and consistent, ranging from 0.04 milliseconds to 3.88 milliseconds. However, enrichment times exhibited substantial variation, spanning from 4214.21 milliseconds to 16726.50 milliseconds. This increased complexity in enrichment time is a notable difference between mid- and low-degree nodes. Consequently, the total processing time for these nodes varied widely, from 7.45 seconds to 45.29 seconds, with more complex nodes like P13035 taking much longer to process.
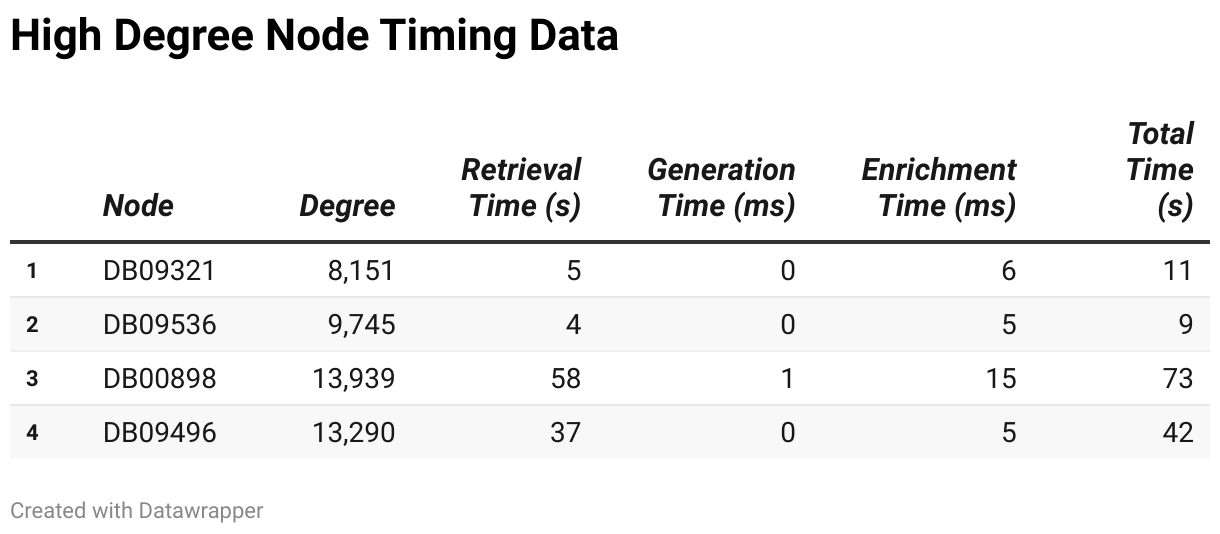
High-degree nodes represent the most complex structures in the dataset. Their performance characteristics include:
For high-degree nodes, retrieval times ranged from 4.11 seconds to 57.93 seconds, significantly higher than those for low- and mid-degree nodes. Generation times were relatively stable, ranging from 0.10 milliseconds to 1.06 milliseconds, showing little variation even with high-degree nodes. Enrichment times, however, ranged from 4808.20 milliseconds to 14638.19 milliseconds, indicating that the enrichment process becomes more time-consuming as node degree increases. As a result, total processing times spanned from 9.02 seconds to 72.57 seconds, with node DB00898 standing out for its exceptionally long processing time, primarily due to its high degree of 13,939.
Insights from the Analysis
- Complexity Increases with Degree:
As the node degree increases, the retrieval and total processing times rise significantly. This is particularly evident in high-degree nodes where retrieval times can exceed 50 seconds, and total times can go beyond 70 seconds.
- Enrichment Process is Key to Total Time:
A significant portion of the total processing time is consumed by the enrichment phase apart from retrieval time, especially for mid- and high-degree nodes. This suggests that optimizing the enrichment process could lead to substantial performance gains.
- Generation Time is Negligible:
Across all node categories, generation time remains low, usually under 1ms. This indicates that generation is not a major bottleneck in the overall performance.
This analysis examined the retrieval times for nodes of varying degrees (low, mid, and high) within a graph system. A key finding is that retrieval time is a major bottleneck, especially for high-degree nodes. Low-degree nodes (Degree = 2) had relatively short retrieval times, averaging 3.59 seconds. Mid-degree nodes (31-51) showed a wider range of retrieval times, between 3.17 and 35.35 seconds, while high-degree nodes (8151-13939) exhibited the most significant delays, with times ranging from 4.11 to 57.93 seconds. The retrieval process became increasingly time-consuming for high-degree nodes, dominating the total processing time in these cases. This is particularly problematic for highly connected nodes, such as key genes or diseases in biomedical knowledge graphs, where relationships across multiple layers must be traversed.
Interestingly, while retrieval time generally contributes more to delays in high-degree nodes, enrichment time surpasses retrieval time for low- and mid-degree nodes. However, the disproportionate retrieval times for high-degree nodes pose scalability and performance challenges, particularly in real-time systems like BioGraphRAG. To address this, potential optimization strategies include implementing caching for frequently queried nodes, improving indexing for faster lookups, leveraging parallel processing to distribute the workload, and precomputing results for critical high-degree nodes. These approaches can significantly reduce retrieval times and improve overall system performance.
The analysis reveals that retrieval time is a significant factor affecting overall system performance, particularly for high-degree nodes. The time taken to traverse and retrieve data from highly connected nodes can exceed 50 seconds, creating substantial delays, especially for real-time or large-scale systems like BioGraphRAG.
How This Analysis Was Helpful:
Identifies Retrieval as a Key Bottleneck: The finding that retrieval time dominates the total processing time provides a clear target for optimization. By focusing on improving retrieval efficiency, overall system performance can be greatly enhanced.
Guides Optimization Efforts: The proposed strategies such as caching, parallelization, and indexing improvements offer actionable paths to reducing retrieval time. These changes are especially crucial for systems dealing with large-scale, complex queries.
Improves Biomedical Research Efficiency: Reducing retrieval time is particularly important in biomedical research, where high-degree nodes often correspond to essential biological entities. Faster query results can lead to quicker insights in areas like drug discovery, precision medicine, and disease modeling.
By addressing retrieval time, especially for high-degree nodes, the performance of graph-based systems can be significantly improved, leading to faster, more scalable querying solutions that better meet the needs of users in real-time applications.
Future Work
While BioGraphRAG has made significant strides in integrating AI with biomedical knowledge graphs to enhance medical insights, there are several areas for future development aimed at improving its performance, scalability, and utility. One key focus will be optimizing performance for high-degree nodes, where complex queries can lead to latency. Strategies such as intelligent caching, parallel processing, and advanced query optimization will be employed to minimize computational overhead and improve efficiency. Additionally, scalability enhancements will address the increasing size of the Biomedical Knowledge Graph (BioKG), leveraging distributed graph databases, optimized data structures, and incremental data updates for efficient handling of large-scale queries.
Future work will also prioritize enriching BioKG by integrating additional biomedical data sources, such as clinical trials and genomic sequences, using semantic integration techniques to ensure consistency across diverse datasets. Machine learning pipelines will be developed for automated data curation, improving data quality and accuracy. Another key area is the enhancement of answer generation, where fine-tuning domain-specific language models and incorporating multimodal data, including biomedical imaging, will provide deeper and more contextually relevant responses.
User experience will be improved through the development of interactive visualizations, customization options, and real-time feedback mechanisms, while reliability will be ensured through comprehensive logging, automated testing, and robust error handling. Furthermore, BioGraphRAG will continue to enhance security by adhering to regulatory standards like HIPAA and GDPR and implementing secure communication protocols and role-based access controls. Finally, collaboration with industry and academic partners, along with the development of comprehensive APIs and open data standards, will further promote integration and interoperability within the biomedical ecosystem.
Conclusion
BioGraphRAG is an innovative system that significantly enhances biomedical research and healthcare decision-making by combining a Biomedical Knowledge Graph (BioKG) with Retrieval-Augmented Generation (RAG). This integration allows BioGraphRAG to generate more accurate, context-rich responses to complex biomedical queries, making it a valuable tool for healthcare professionals, researchers, and patients alike. By relying on structured, verified biomedical data, BioGraphRAG provides trustworthy, explainable, and comprehensive answers, addressing the limitations of traditional AI models.
The technical foundation of BioGraphRAG is built on a modular architecture that combines FastAPI for backend operations, Chainlit for a user-friendly interface, and LlamaIndex to facilitate efficient querying of the knowledge graph. This architecture ensures that BioGraphRAG is scalable, responsive, and capable of handling large amounts of biomedical data while delivering accurate results. A key achievement in the project was optimizing the performance of BioGraphRAG when dealing with high-degree nodes—entities with many connections—by implementing intelligent caching and parallel processing strategies.
However, the potential for BioGraphRAG doesn’t stop here. Future work will focus on expanding BioGraphRAG’s data sources to incorporate a wider range of biomedical information, such as clinical trials, genomic data, and patient records. This will make BioGraphRAG even more powerful by providing richer, more diverse responses. Enhancing the user interface is also a priority, with plans to add interactive visualizations, real-time feedback, and customization options to improve usability. Additionally, we aim to further optimize BioGraphRAG’s scalability and efficiency, ensuring that it can handle even larger datasets without compromising performance.
Another critical aspect of future development involves refining the enrichment process for AI-generated answers. By incorporating more advanced natural language processing techniques and multimodal data, such as medical images, BioGraphRAG will be able to provide even deeper and more detailed responses. Security and compliance with data protection regulations will continue to be a priority, ensuring that sensitive biomedical data is handled responsibly.
BioGraphRAG is poised to become a leading tool in biomedical knowledge management. With its ability to combine advanced AI with structured biomedical data, it addresses many of the challenges faced by traditional systems. As it evolves, BioGraphRAG will continue to provide valuable insights that can improve healthcare outcomes and drive innovation in biomedical research.
References
https://github.com/dsi-bdi/biokg BioKG: a comprehensive, large-scale biomedical knowledge graph for AI-powered, data-driven biomedical research
https://github.com/ynchuang/DiscoverPath DiscoverPath: A Knowledge Refinement and Retrieval System for Interdisciplinarity on Biomedical Research
https://arxiv.org/abs/2407.12216v1 https://doi.org/10.48550/arXiv.2407.12216 Mindful-RAG: A Study of Points of Failure in Retrieval Augmented Generation
NVIDIA. (2023, November 15). What Is Retrieval-Augmented Generation aka RAG. NVIDIA Blog. https://blogs.nvidia.com/blog/what-is-retrieval-augmented-generation/
https://pmc.ncbi.nlm.nih.gov/articles/PMC10760044/
Google Cloud. (n.d.). What Is Retrieval Augmented Generation (RAG)? Google Cloud. https://cloud.google.com/use-cases/retrieval-augmented-generation
Prompting Guide. (n.d.). Retrieval Augmented Generation (RAG). Prompting Guide. https://www.promptingguide.ai/techniques/rag
Oracle. (2023, September 19). What Is Retrieval-Augmented Generation (RAG)? Oracle. https://www.oracle.com/artificial-intelligence/generative-ai/retrieval-augmented-generation-rag/
Stack Overflow. (2023, October 18). Retrieval augmented generation: Keeping LLMs relevant and current. Stack Overflow Blog. https://stackoverflow.blog/2023/10/18/retrieval-augmented-generation-keeping-llms-relevant-and-current/
Youn, C., et al. (2021). Deep learning-based knowledge graph to predict protein-drug-disease associations. Scientific Reports, 11(1), 1-13.
Nickel, M., Murphy, K., Tresp, V., & Gabrilovich, E. (2016). A review of relational machine learning for knowledge graphs. Proceedings of the IEEE, 104(1), 11-33.
Rotmensch, M., Halpern, Y., Tlimat, A., Horng, S., & Sontag, D. (2017). Learning a health knowledge graph from electronic medical records. Scientific Reports, 7(1), 1-11.
Zeng, X., et al. (2020). A comprehensive survey of knowledge graph embeddings with literals: Techniques and applications. Expert Systems with Applications, 158, 113437.
Hu, W., et al. (2021). Open graph benchmark: Datasets for machine learning on graphs. Advances in Neural Information Processing Systems, 34, 22118-22133.
Choi, E., Bahadori, M. T., Song, L., Stewart, W. F., & Sun, J. (2017). GRAM: Graph-based attention model for healthcare representation learning. In Proceedings of the 23rd ACM SIGKDD International Conference on Knowledge Discovery and Data Mining (pp. 787-795).
Wood, D. E., et al. (2021). RTX-KG2: A system for building and exploring biomedical knowledge graphs. bioRxiv.
Zhang, Y., et al. (2022). BioKG: A comprehensive, large-scale biomedical knowledge graph for AI-powered, data-driven biomedical research. Scientific Data, 9(1), 1-14.
Li, J., et al. (2022). A survey on biomedical knowledge graphs: Data, tasks and methods. IEEE/ACM Transactions on Computational Biology and Bioinformatics.