Tools
Compare Multiple Projects with this GitHub Stats tool

If you have project code hosted on GitHub, chances are you might be interested in checking some numbers and stats such as stars, commits and pull requests.
You might also want to compare some similar projects in terms of the above mentioned stats, for whatever reasons that interest you.
We have the right tool for you: the simple and easy-to-use little tool called GitHub Stats.
Let's dive right in to what we can get out of it.
Getting started
This interactive tool is really easy to use. Follow the three steps below and you'll get what you want in real-time:
- Head to the GitHub repo of the tool
- Enter as many projects as you need to check on
- Hit the Update button beside each metric
In this article we are going to compare three most popular machine learning projects for you.

General repository information

So basically these metrics can answer the following questions for you:
- Which is the freshest project?
tensorflow wins because its last push happened just an hour ago.
- Which project gets the most attention?
tensorflow wins because it has the most watchers.
Popularity metrics
It's common that you want to know which project gains the most popularity.
But how can you measure popularity?
By stars and forks each project has gained.
See the screenshots below for the comparison results:
Star

Fork

Apparently tensorflow gets the strongest momentum during the entire life cycle.
Maturity metrics
Besides popularity, you might also care about the maturity of a project, which is worth considering. Generally speaking, the more mature a project is, the more powerful as well as stable it is.
How to measure the maturity of a project?
By the most recent version, number of issues and number of pull requests.
See the screenshots below for the comparison results:
Release

Issues
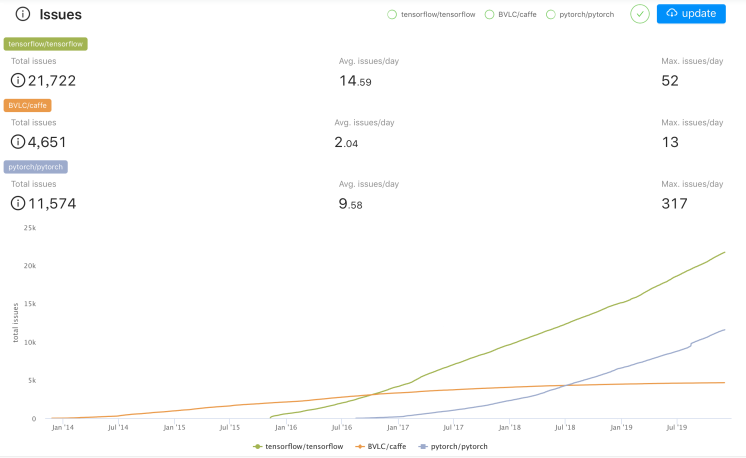
Pull Requests

tensorflow and Pytorch have been maintained constantly while caffe is still at its 1.0 version with much fewer issues and pull requests than its two peers.
It's your decision to make which to follow.
Conclusion
Data matters. And we hope this simple GitHub Stats tool can bring you the insight required. Also feel free to use it your own way.
Submit an issue if you find any valuable metric is missing in the tool. Here's the project repo again: https://vesoft-inc.github.io/github-statistics/
Enjoy!