Development Tools
Feb 28, 2022
Introducing Nebula Dashboard: The brain of your NebulaGraph cluster
Riveryzzz
Distributed database systems like NebulaGraph perform well in storing data but they make DevOps difficult and complicated. Building and managing clusters is pain and time-consuming. Not to mention it is not easy to back up and upgrade the system, especially in the production environment.
Introducing Nebula Dashboard, a visualization tool that helps you manage your NebulaGraph clusters in an intuitive web user interface. Nebula Dashboard can help DevOps engineers and database administrators (DBAs) reduce the daily cost of managing a NebulaGraph cluster and ensure the stability of their systems.
If you want a free trial of Nebula Dashboard enterprise edition, click here: https://dashboard.nebula-graph.io/
The structure
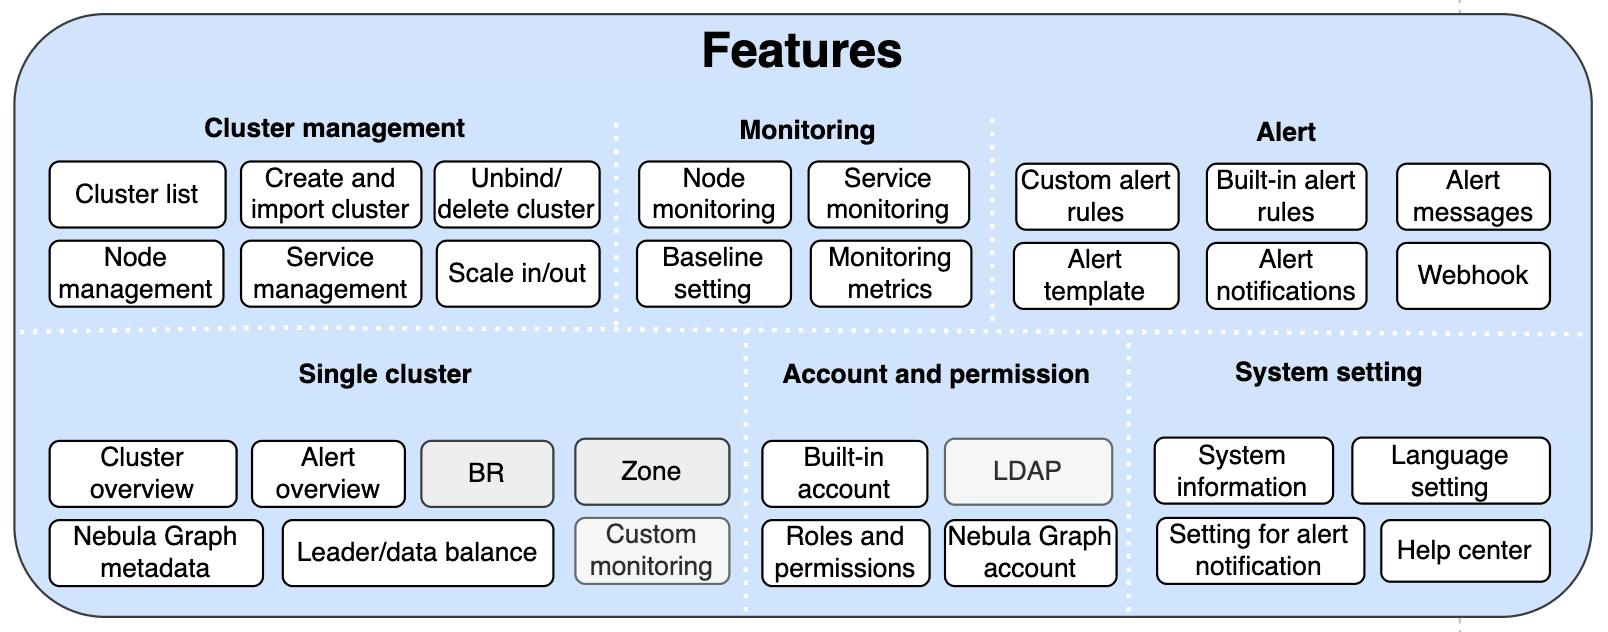
The following figure gives the six main features of Nebula Dashboard. They are cluster management, monitoring, alarming, single cluster configuration, access control, and system setting.
The one dashboard to rule them all
First, let's dive into the main features of Nebula Dashboard: multi-cluster orchestration & lifecycle management, monitoring and alerting, and access control.
Multi-cluster orchestration & lifecycle management
The lifecycle for a NebulaGraph cluster refers to the journey from the creation of a cluster to management to eventual recycling.
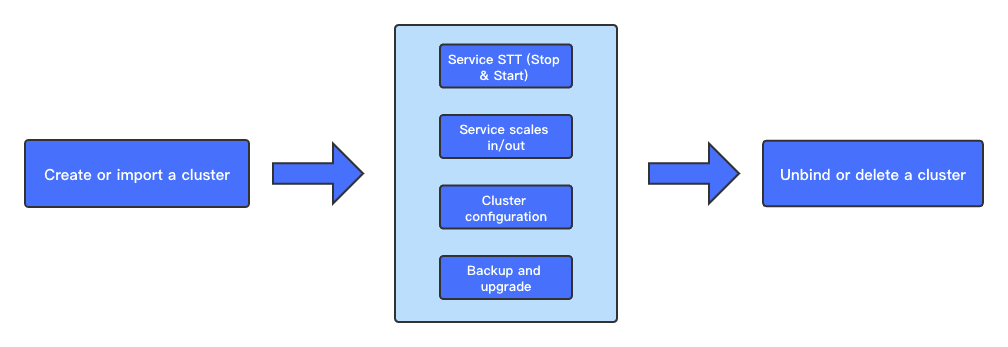
Nebula Dashboard can manage the full lifecycle of your NebulaGraph cluster in a visualized way.
When you have not created a NebulaGraph cluster, Nebula Dashboard enables you to start the creation of a new cluster. If you are already working with NebulaGraph clusters, you can import those clusters into Nebula Dashboard in batch and monitor or manage them there. We will go through the entire process of creating and managing clusters in this chapter.
Create a cluster from Nebula Dashboard
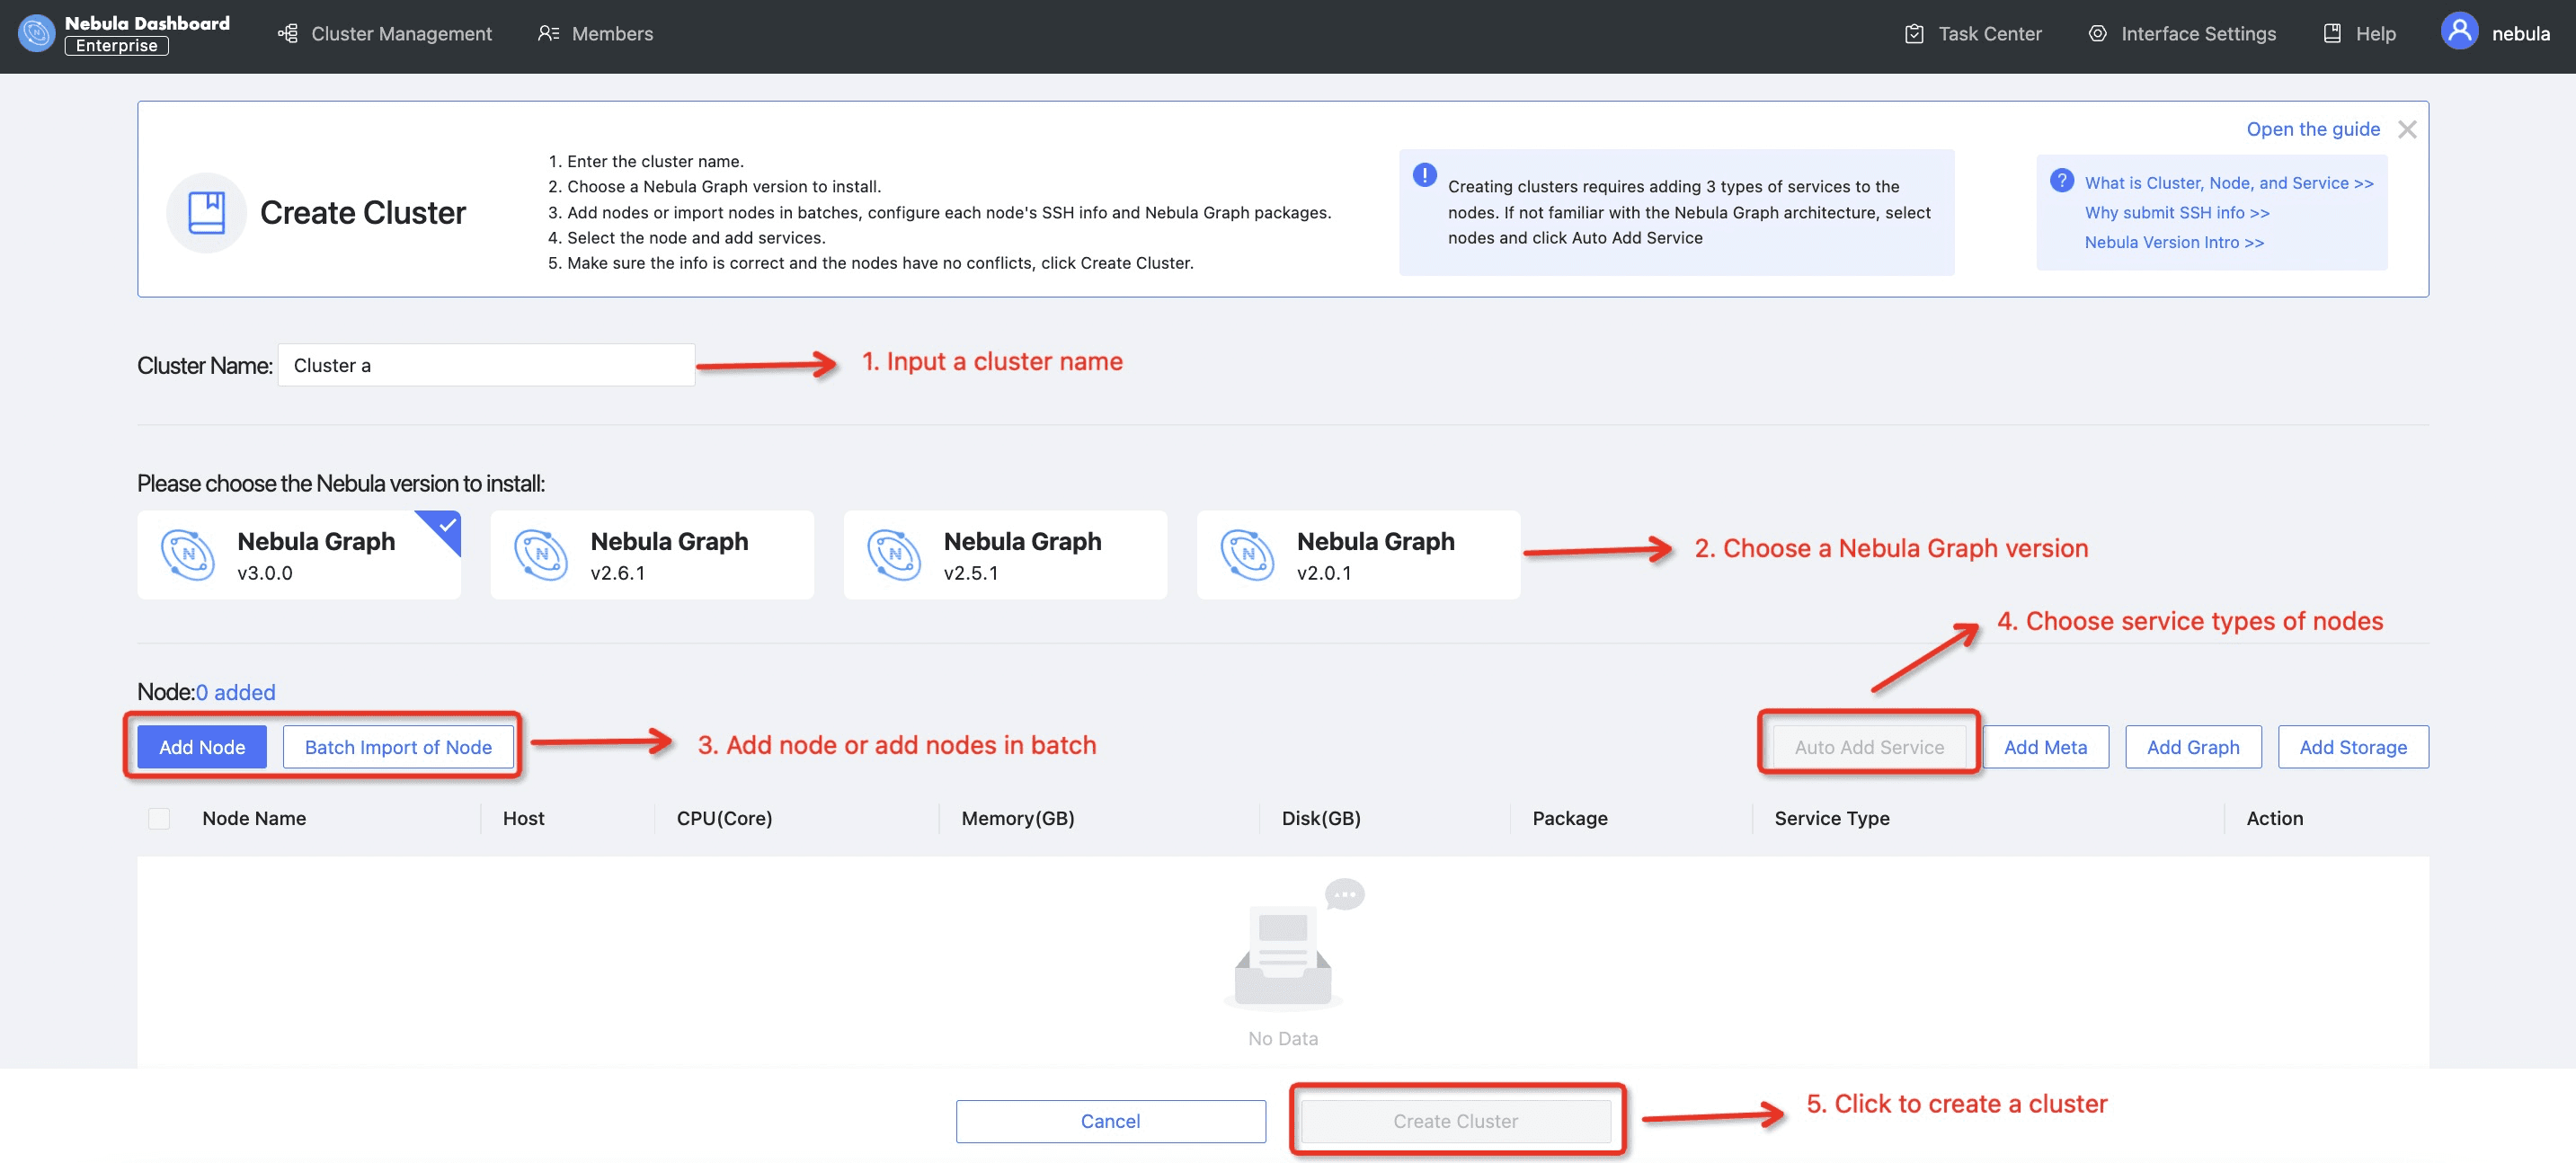
There are five steps to create a cluster, as shown in the figure above:
Input a unique cluster name
Choose the NebulaGraph version that you want to create a cluster. Please note that Nebula Dashboard only supports NebulaGraph v2.0 and above. By default, Nebula Dashboard provides three built-in installation package: v2.6.1, v2.5.1, and v2.0.1. It will also support NebulaGraph v3.0.0 once it is released in mid February 2022.
Add nodes to the cluster. You may need to authorize the step from SSH.
Select the services to be deployed on different nodes. For simplicity, you can also use the "Auto Add Service” feature to evenly deploy services to different nodes.
Confirm everything is OK and click “Create Cluster.” And voilà, you have your NebulaGraph cluster up and running.
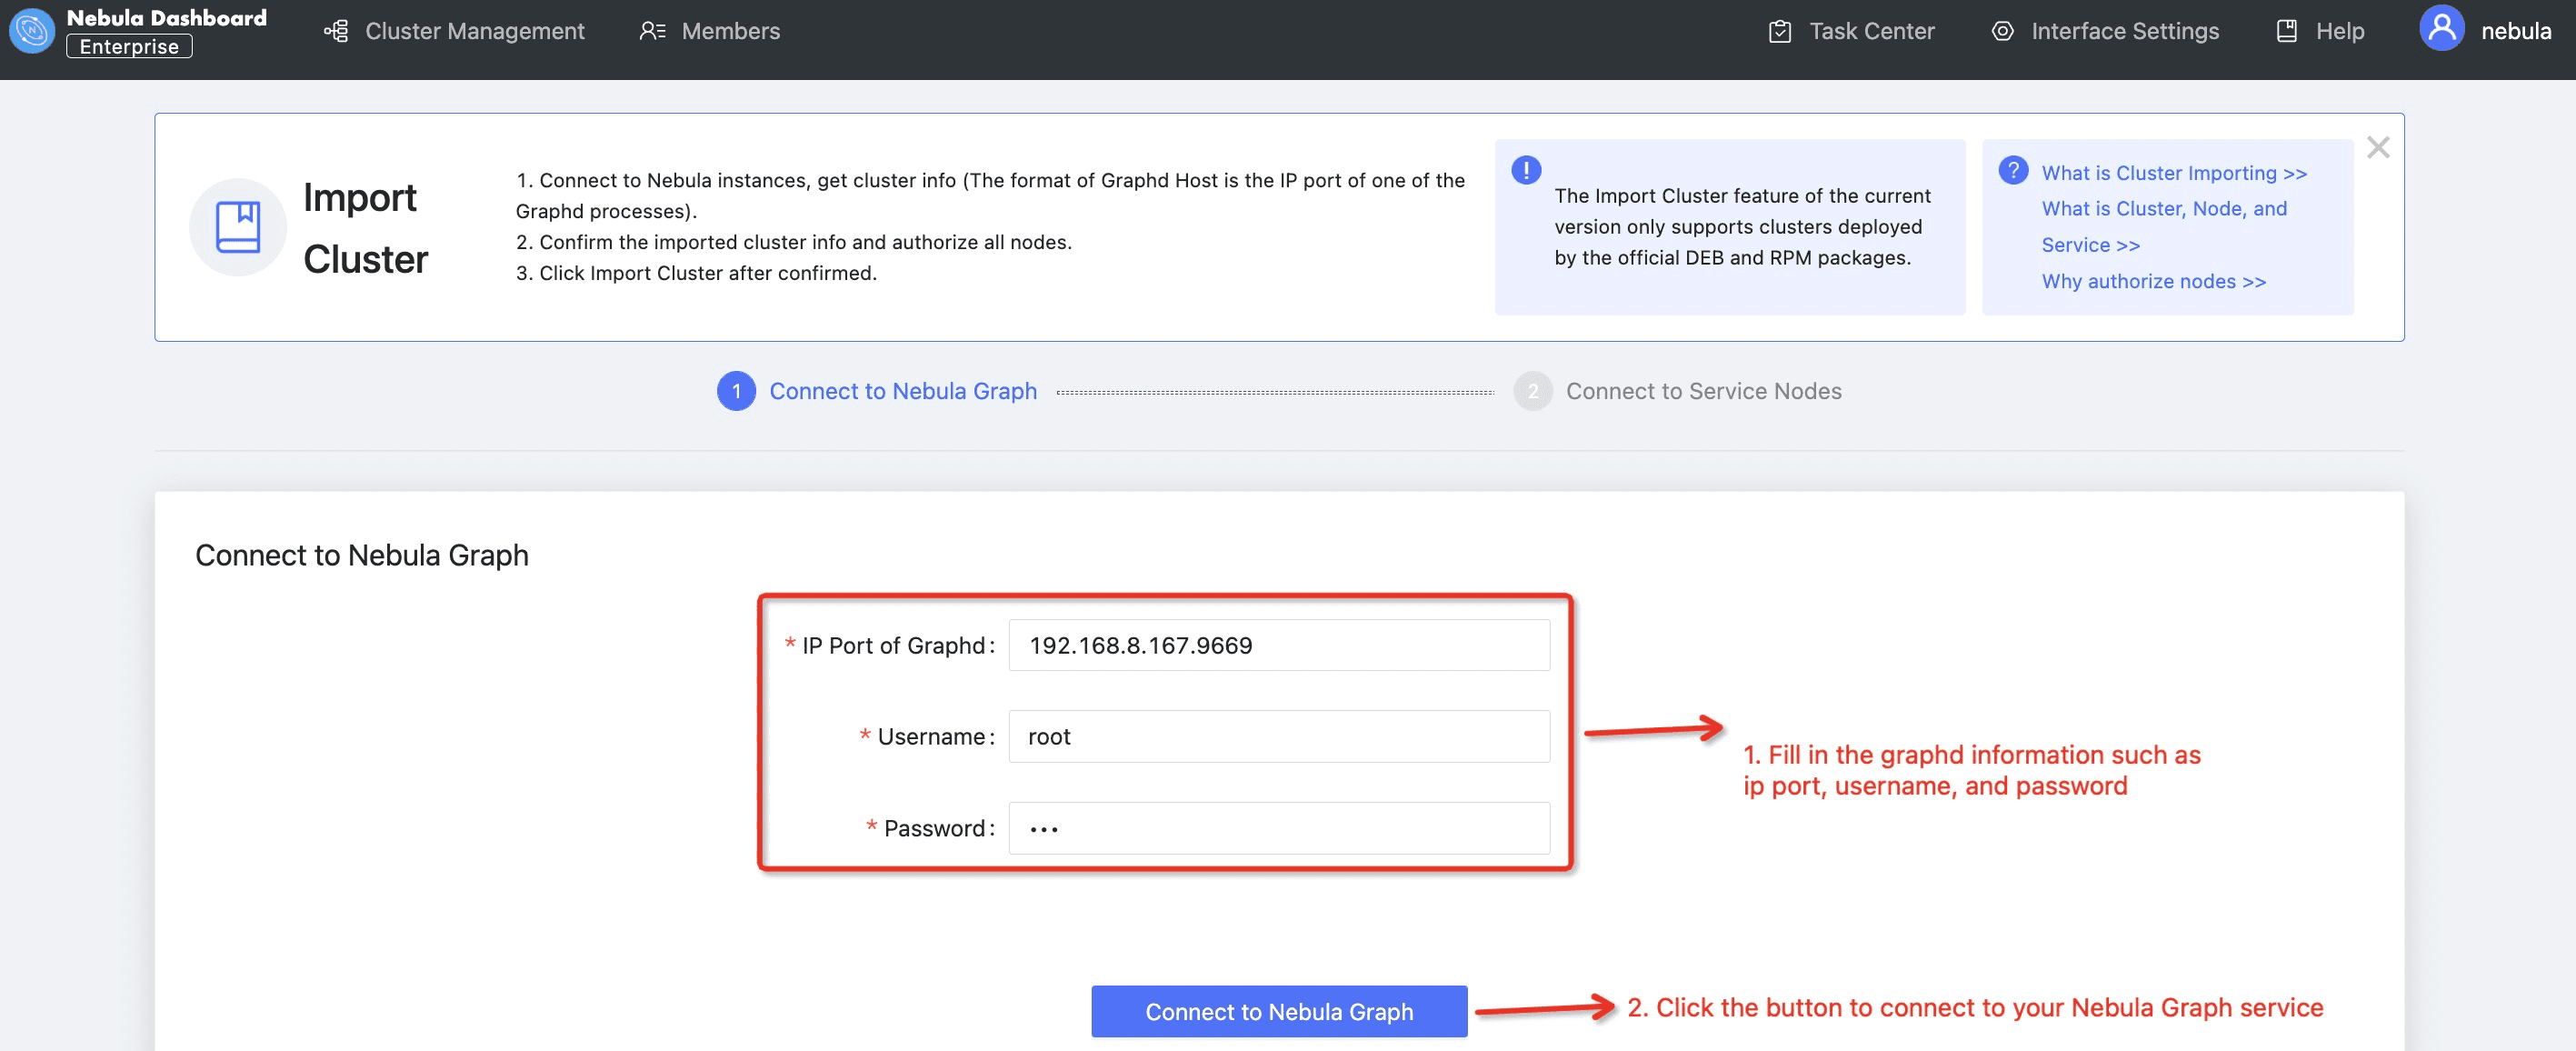
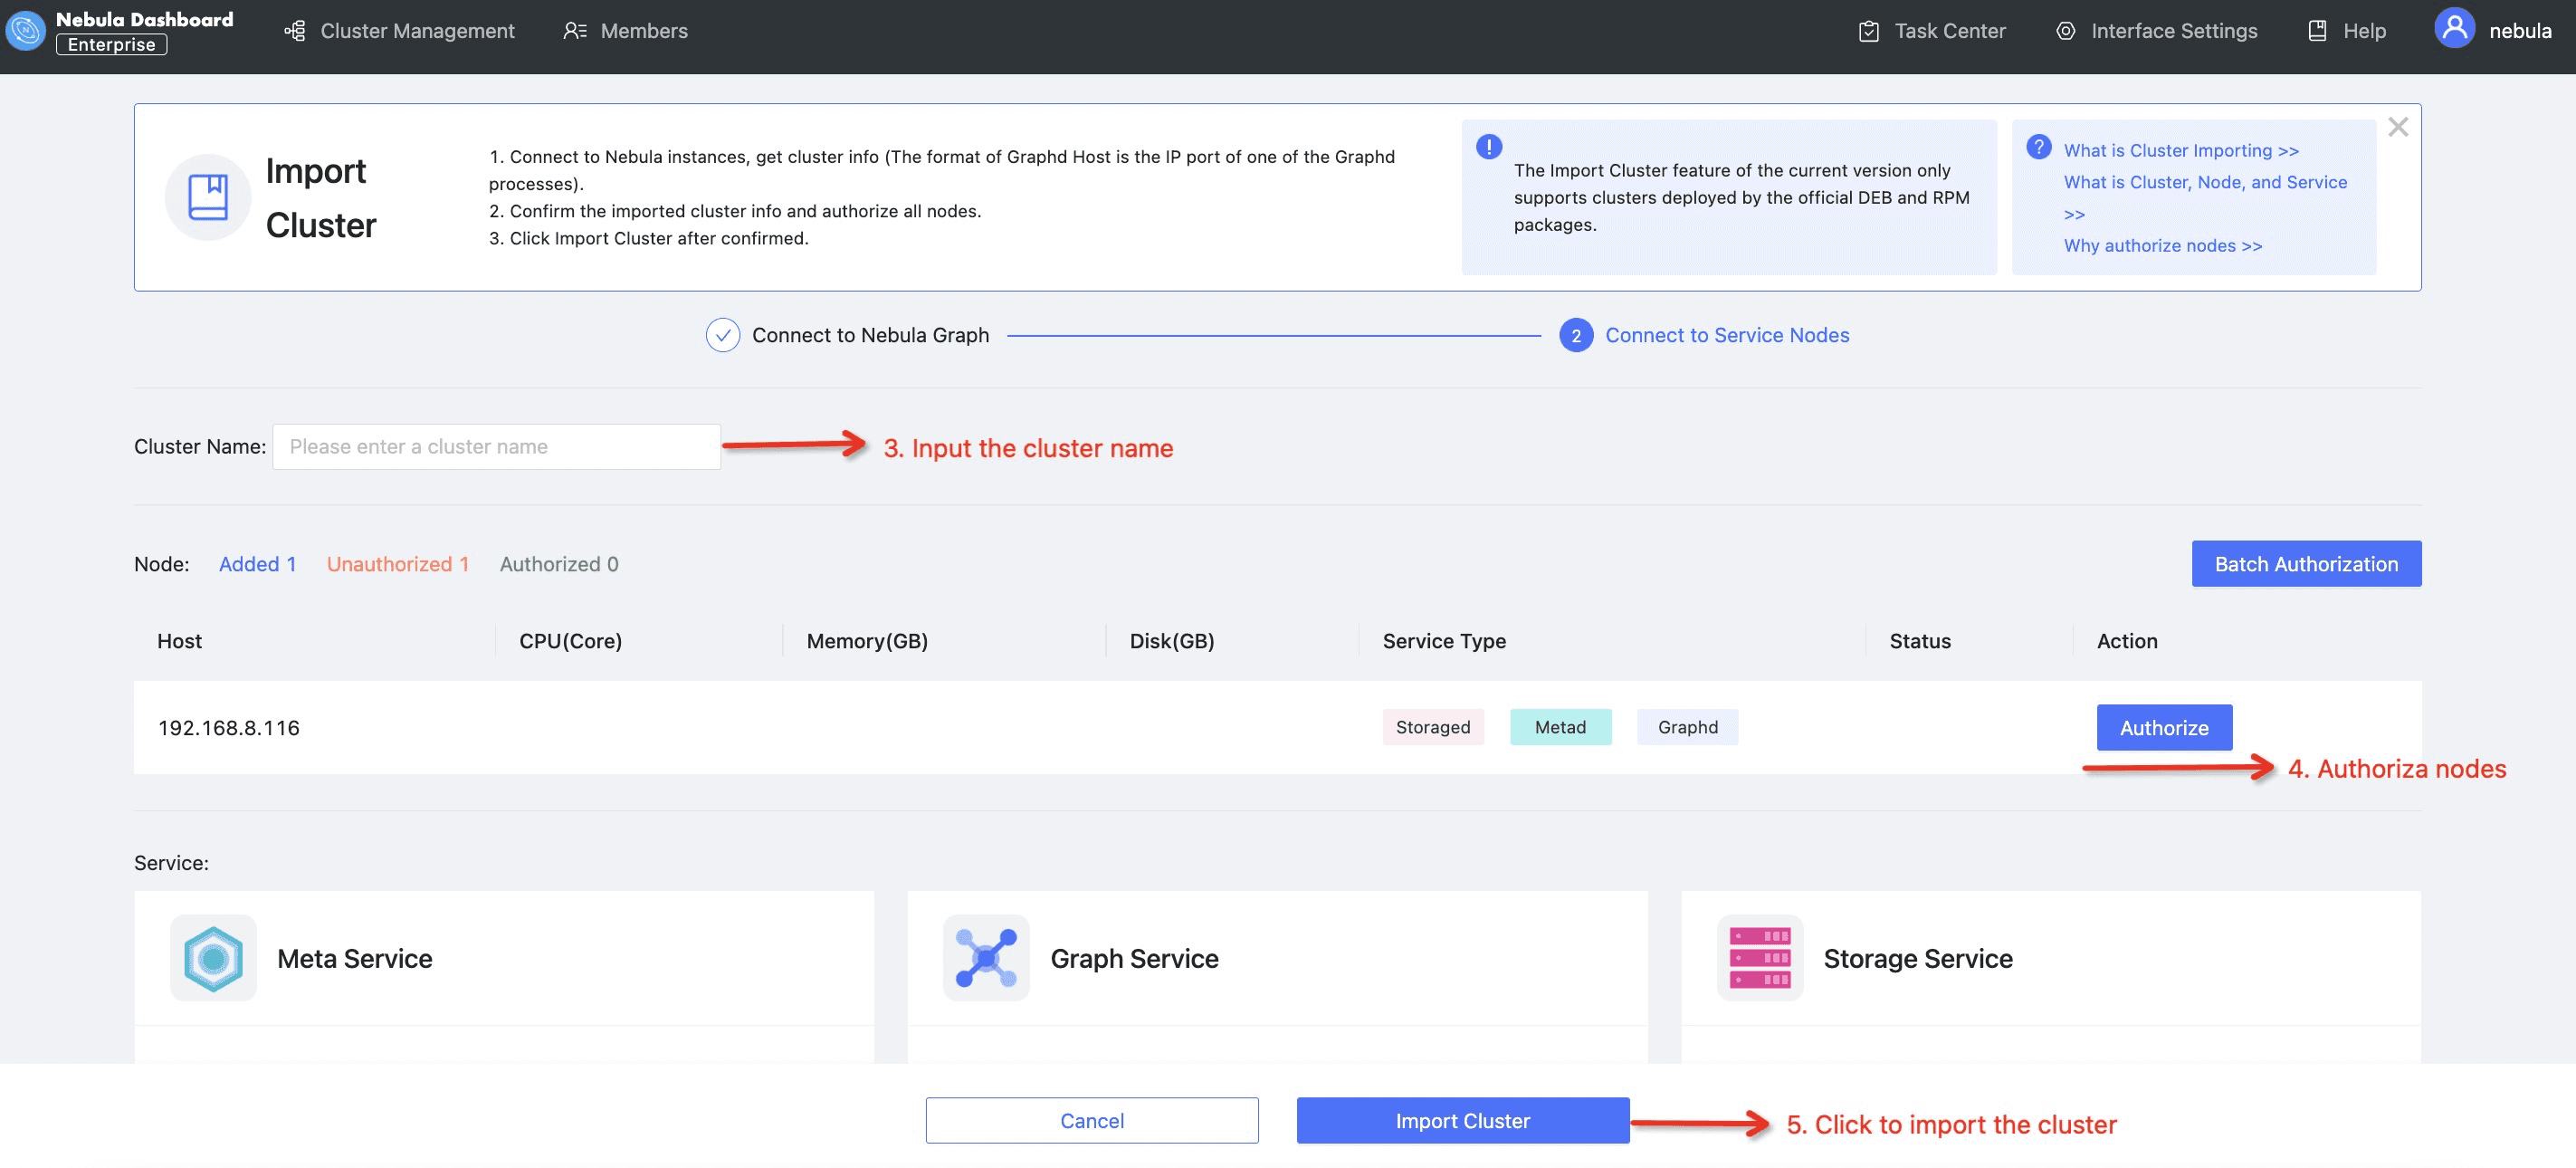
Importing a cluster into Nebula Dashboard
If you have a NebulaGraph cluster running, you can import it into Nebula Dashboard to manage it in a graphic user interface.
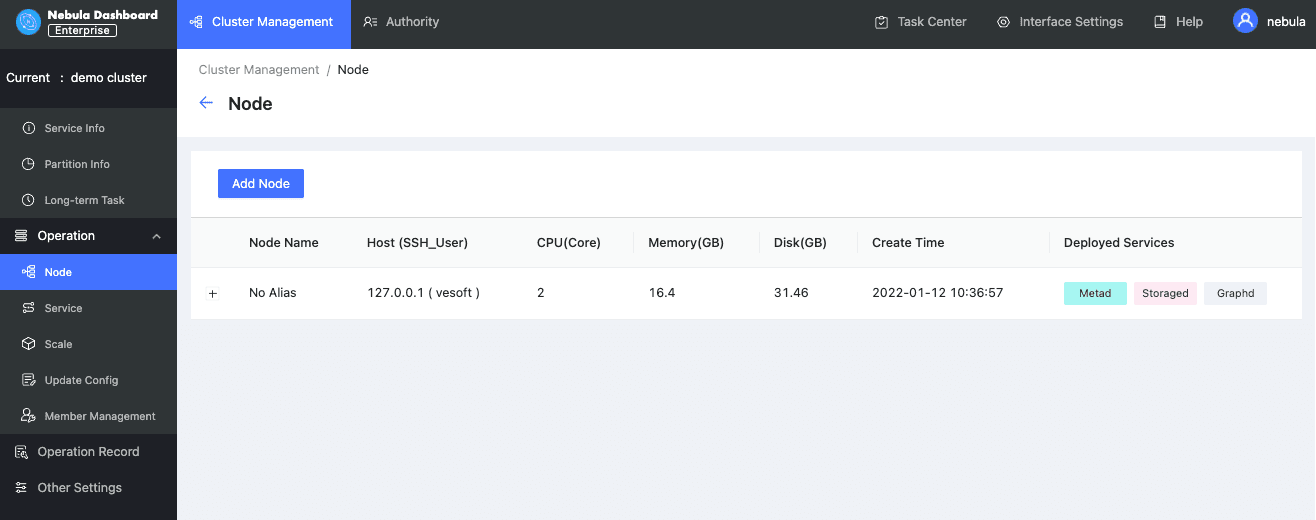
Cluster operations and maintenance
Once you have completed the above two steps, you can use Nebula Dashboard to manage your clusters. Cluster management can be tedious. It involves repeated actions such as management of clusters, nodes and services. Nebula Dashboard can free DevOps engineers from this unbearable boredom by simplifying the whole process of cluster management.
Here are what you can do with Nebula Dashboard to manage your cluster:
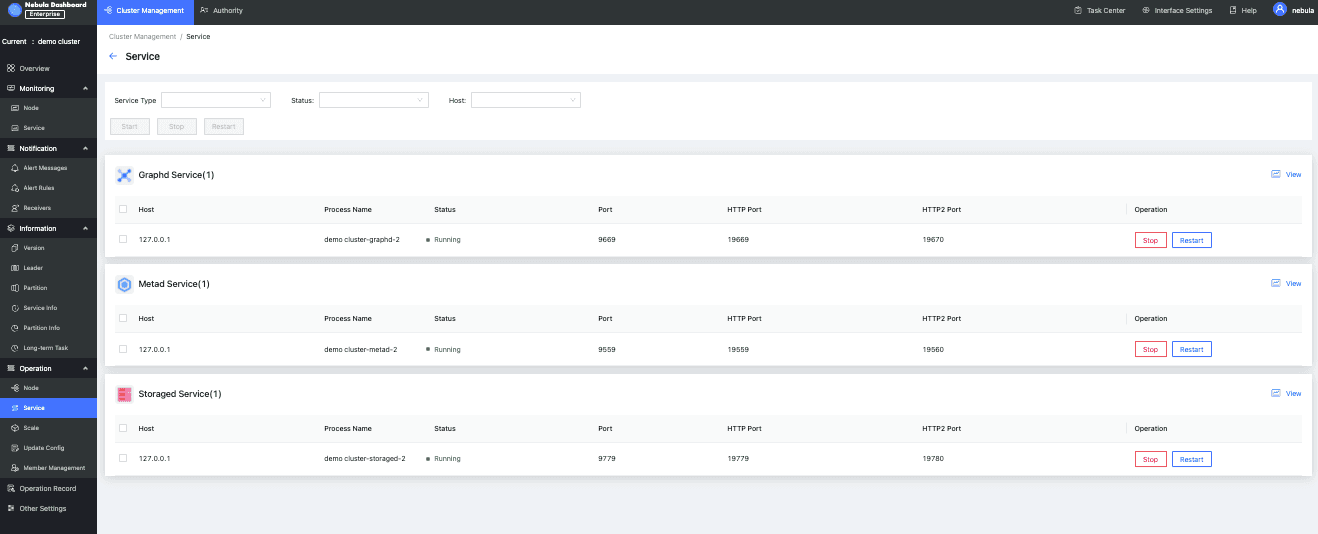
Node and service management Nebula Dashboard’s Node management and Service management modules will give you an intuitive overview of all the information about running nodes in the cluster and services in each node. You can do actions such as adding empty nodes and starting or stopping services in a node.
Be informed. Be alerted.
Monitoring the health of a cluster is the first priority forNebula Dashboard. Nebula Dashboard provides cluster overview, node metrics monitoring, service metrics monitoring, and alarm notification capabilities to help DevOps engineers stay informed of their NebulaGraph cluster health.
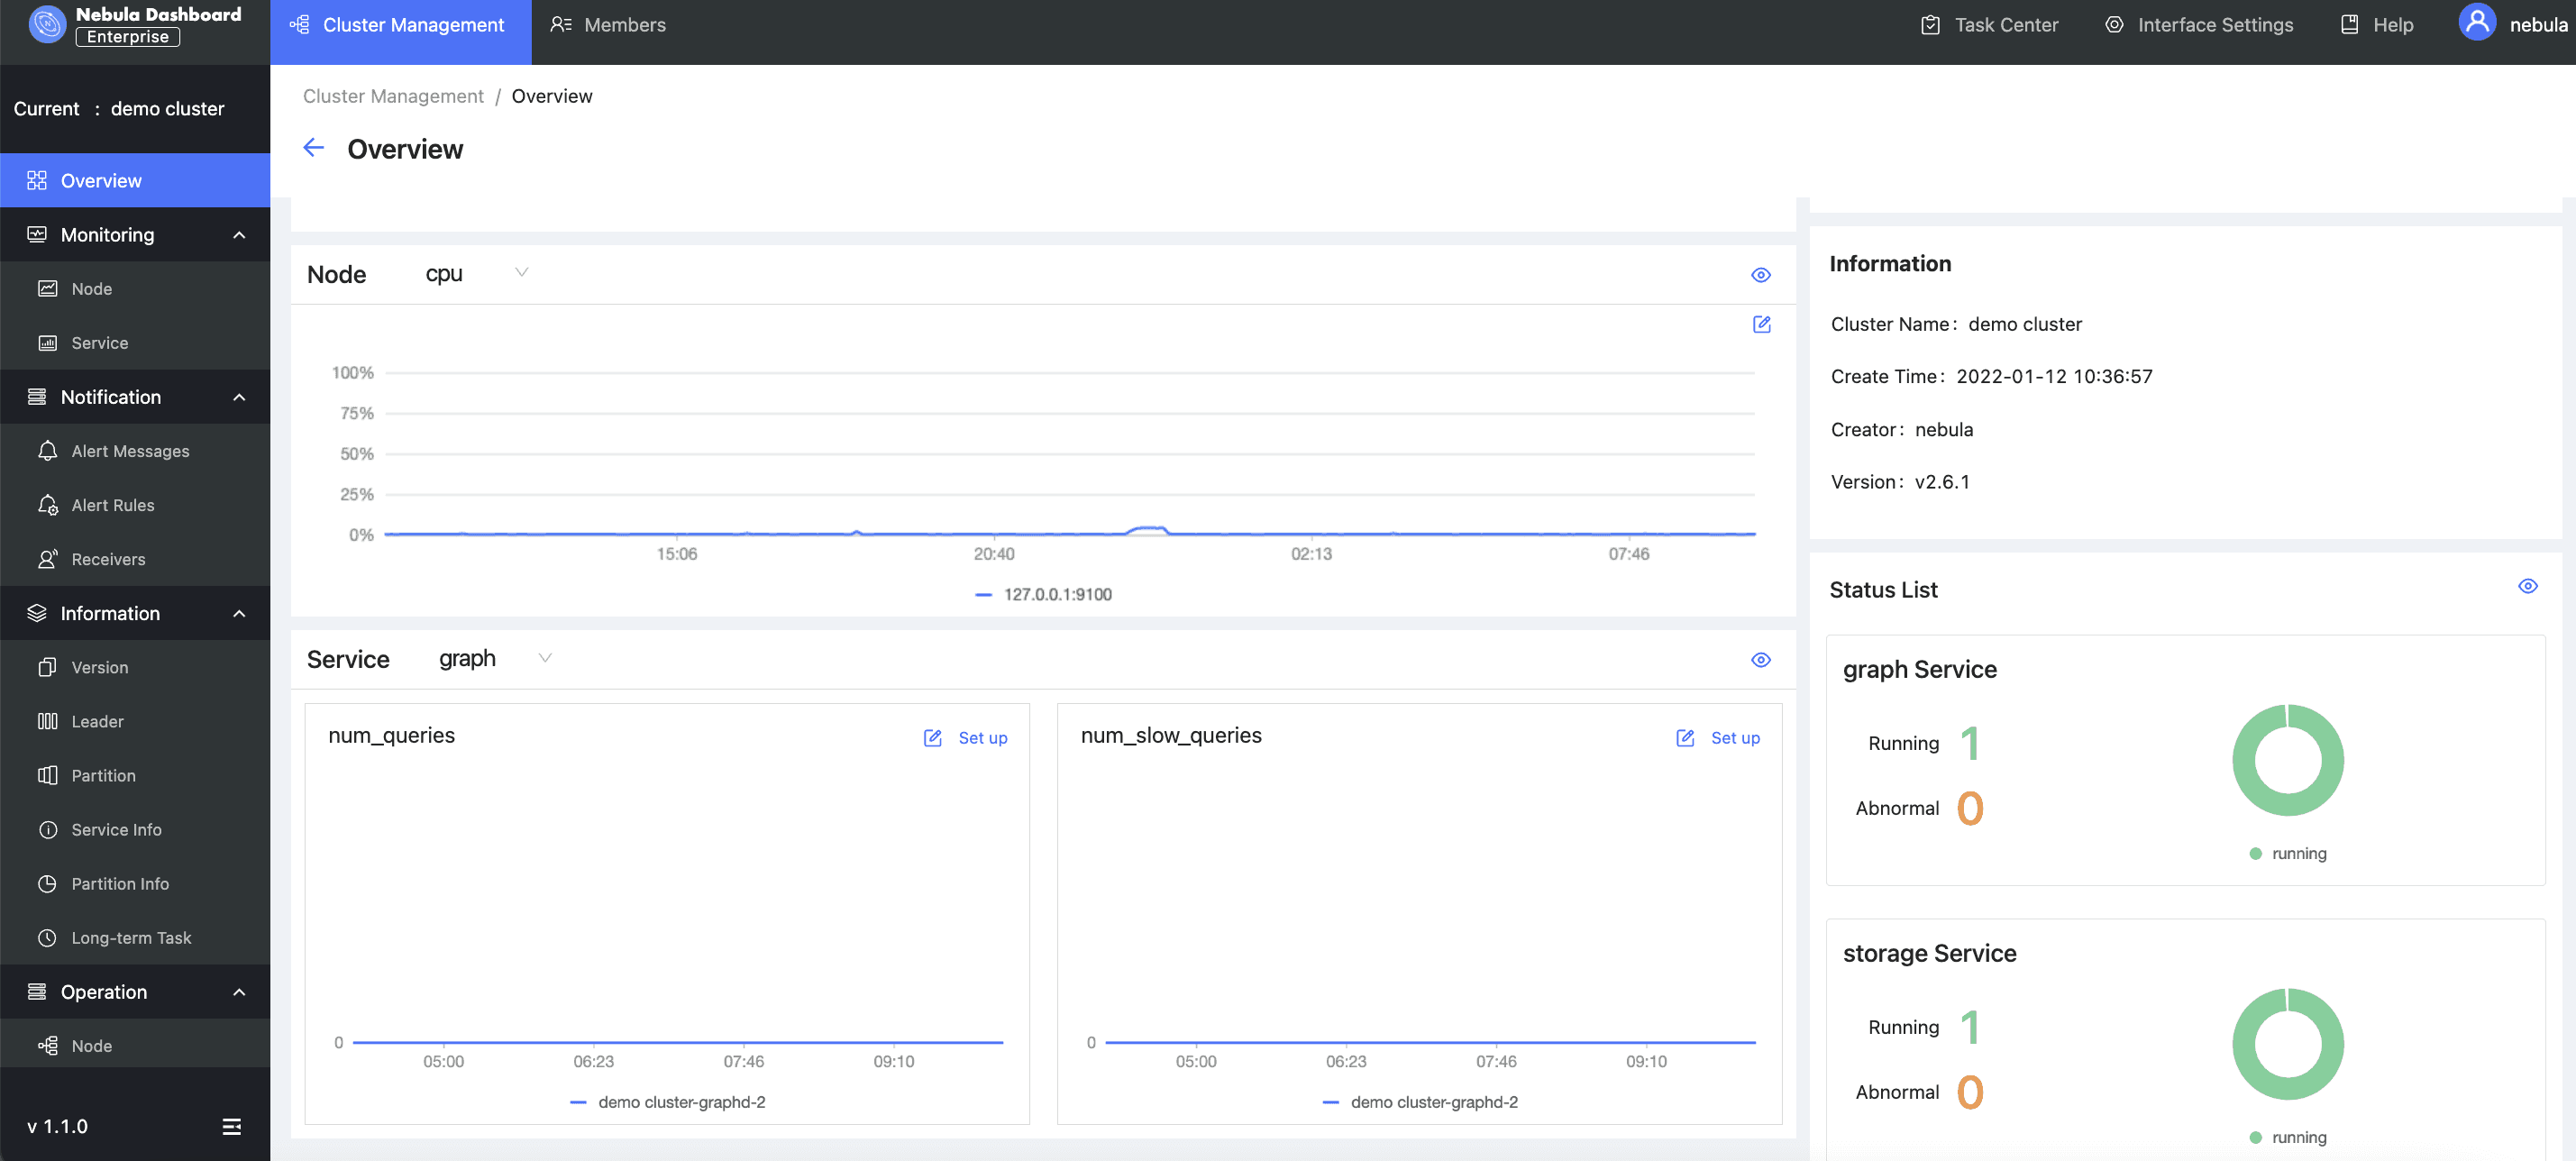
Cluster overview
In the overview section, DevOps engineers can quickly understand the overall situation of the current cluster, including the distribution of services in the node, operational status, and customize indicators of their most concerned metrics to stay alarmed.
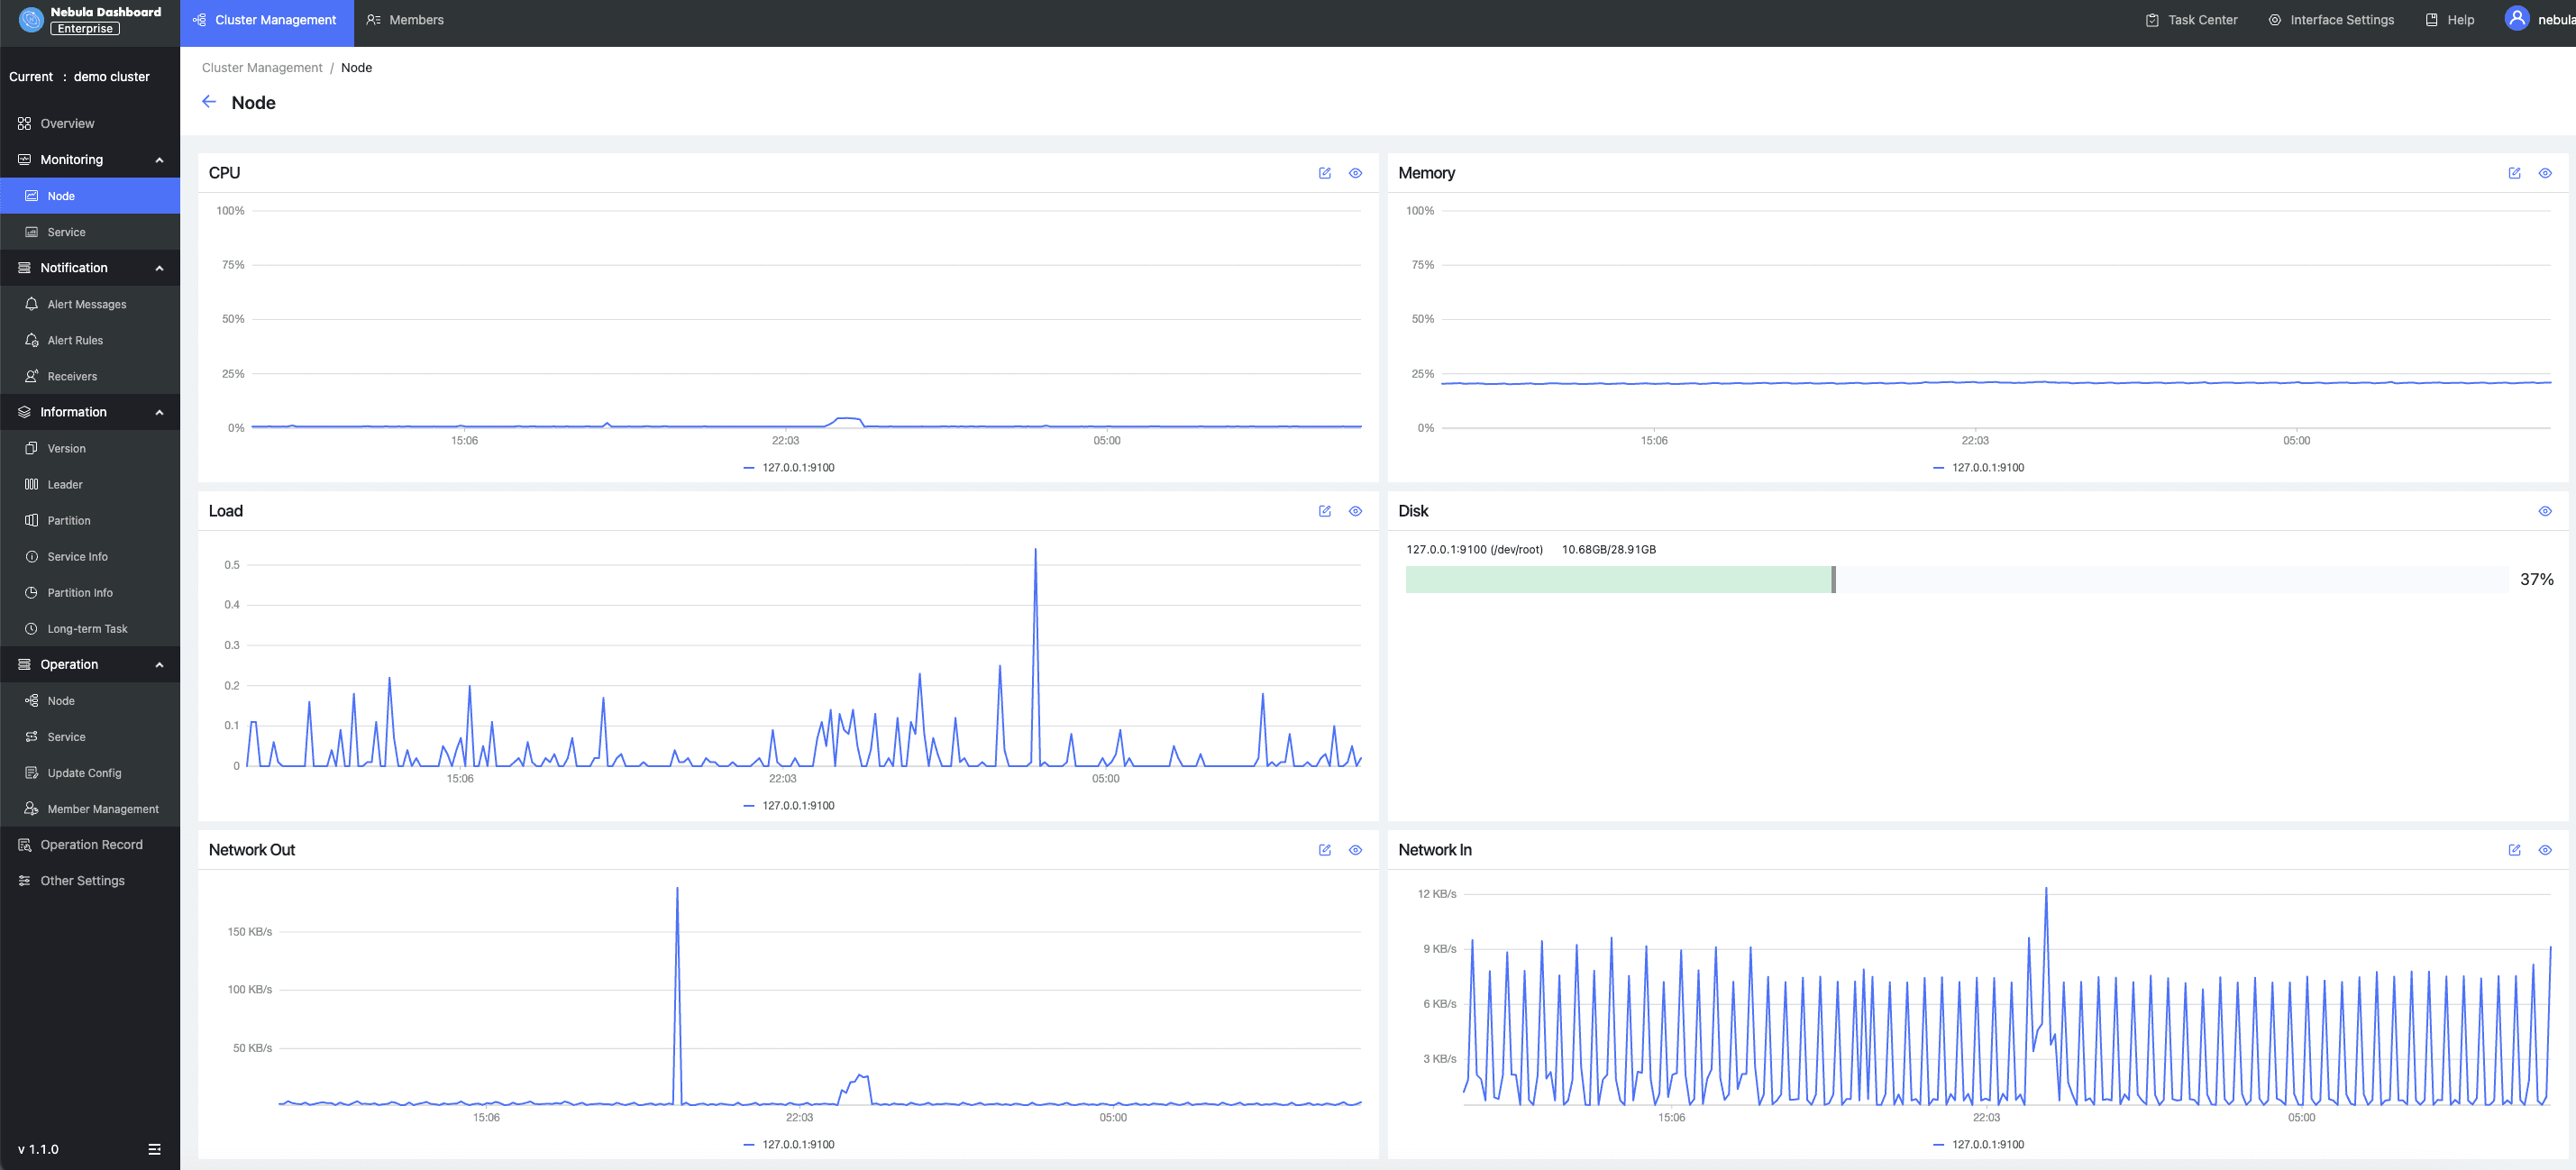
Node monitoring
Node monitoring is used to present all the information of a particular NebulaGraph node, including its CPU usage, memory, load, and disk. You can also set a baseline for a specific metric so that you can be alerted when the metric exceeds the baseline.
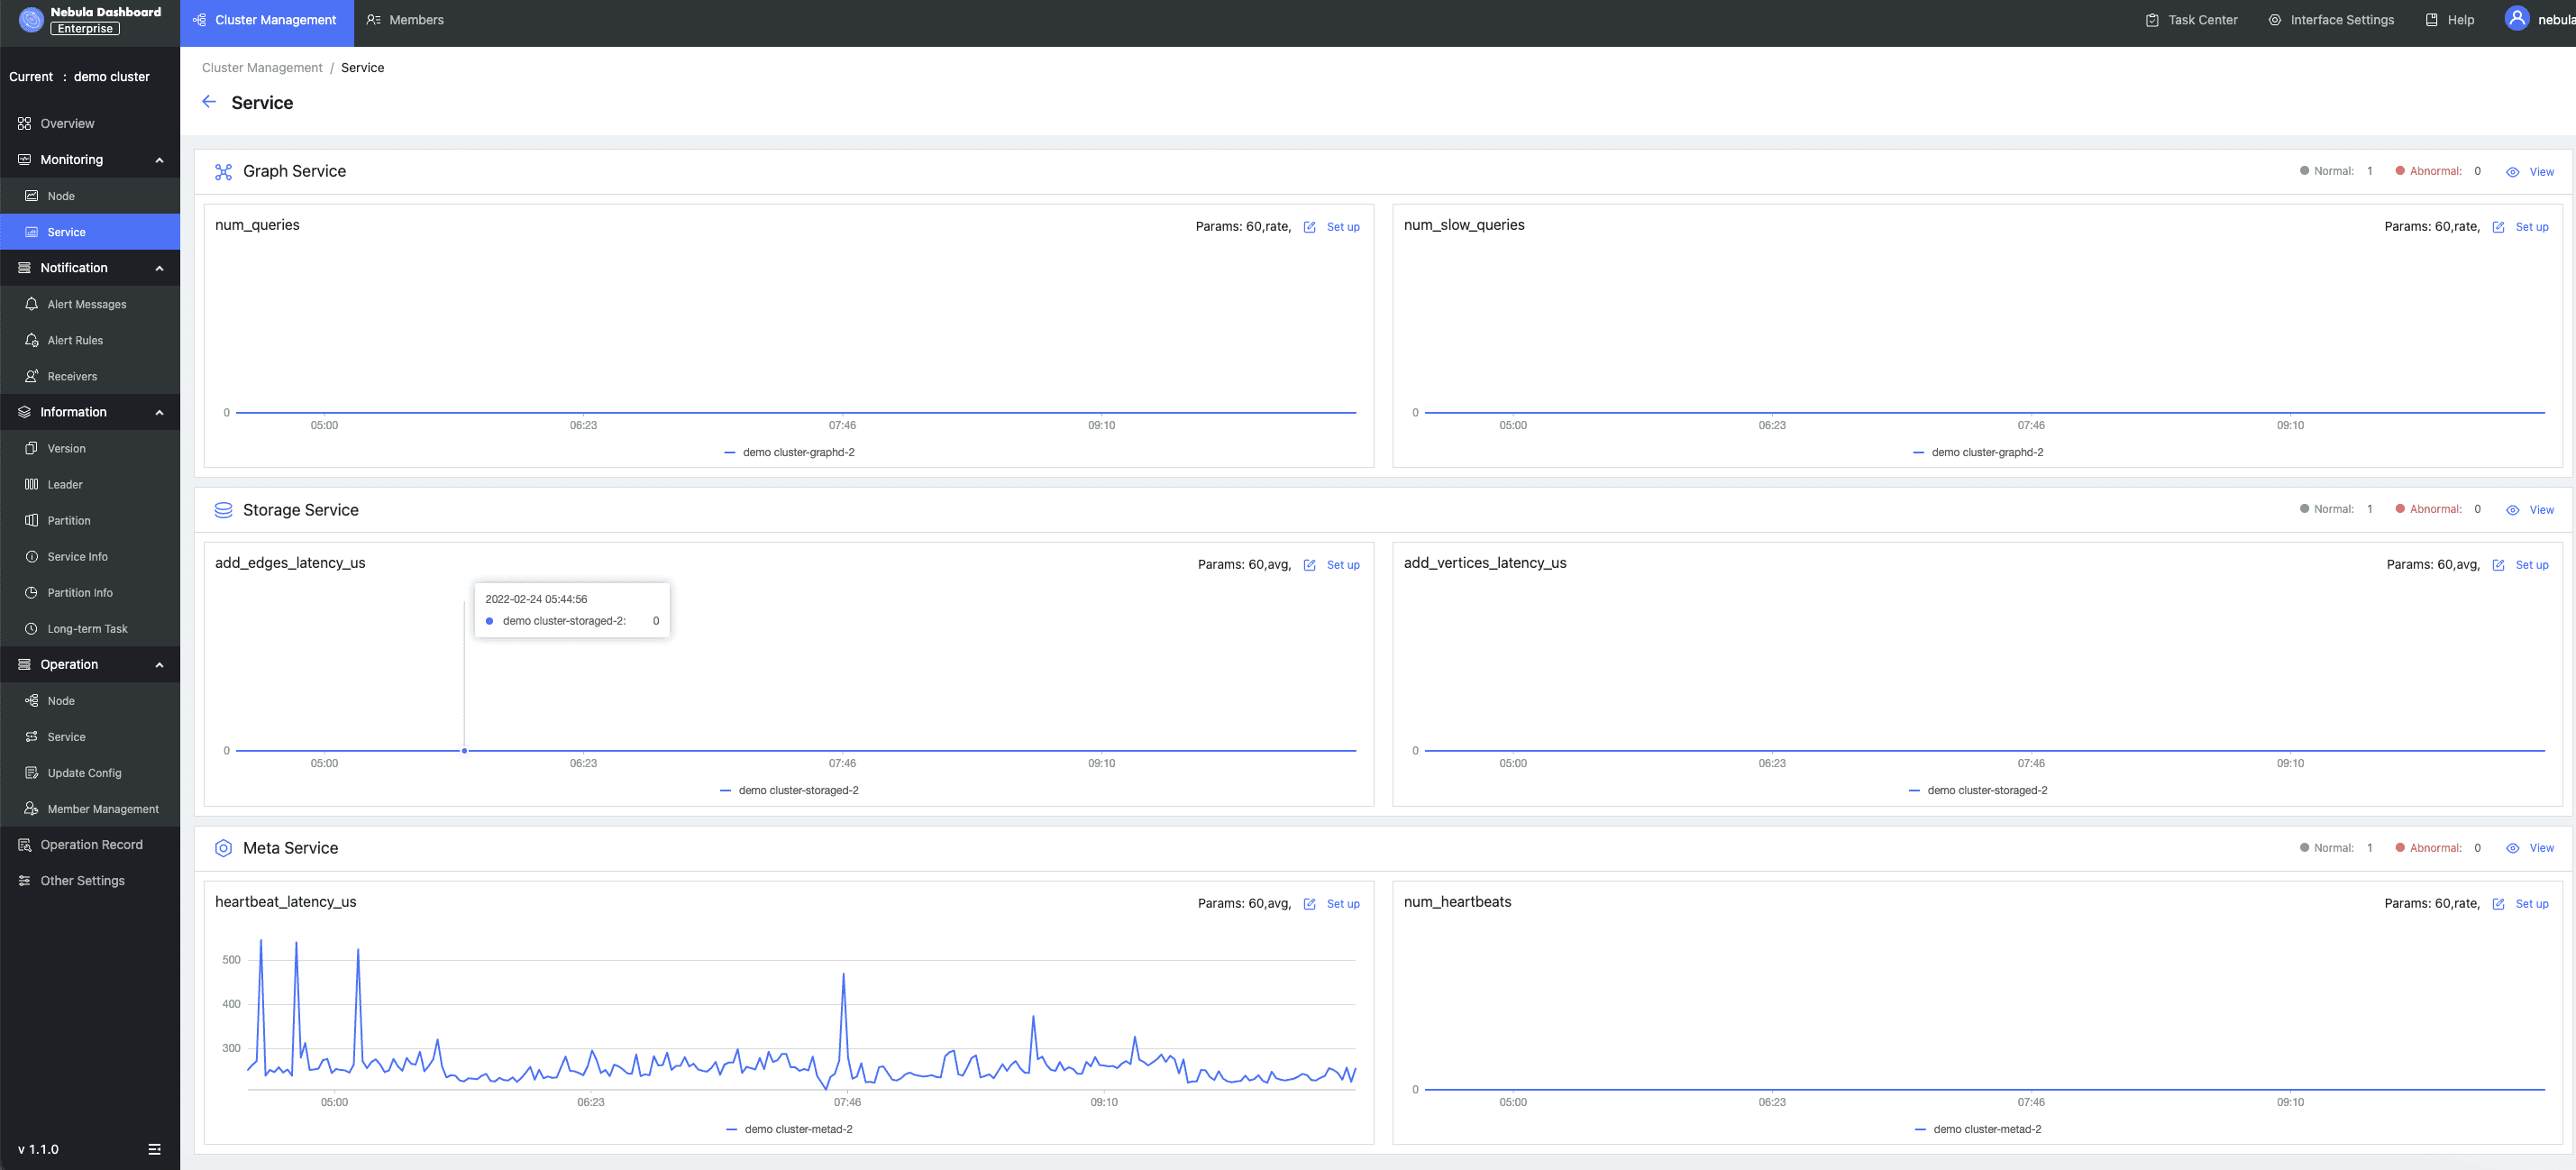
Service monitoring
Service monitoring mainly involves the metrics of three services of NebulaGraph clusters. The three services are graphd, metad and storaged. Currently, Nebula Dashboard can present dozens of cluster metrics and monitor them based on their aggregations and averages. These metrics include the number of slow queries and errors in the graphd service, vertex and edge latencies of storaged, and heartbeat latencies of the metad service.
Alert
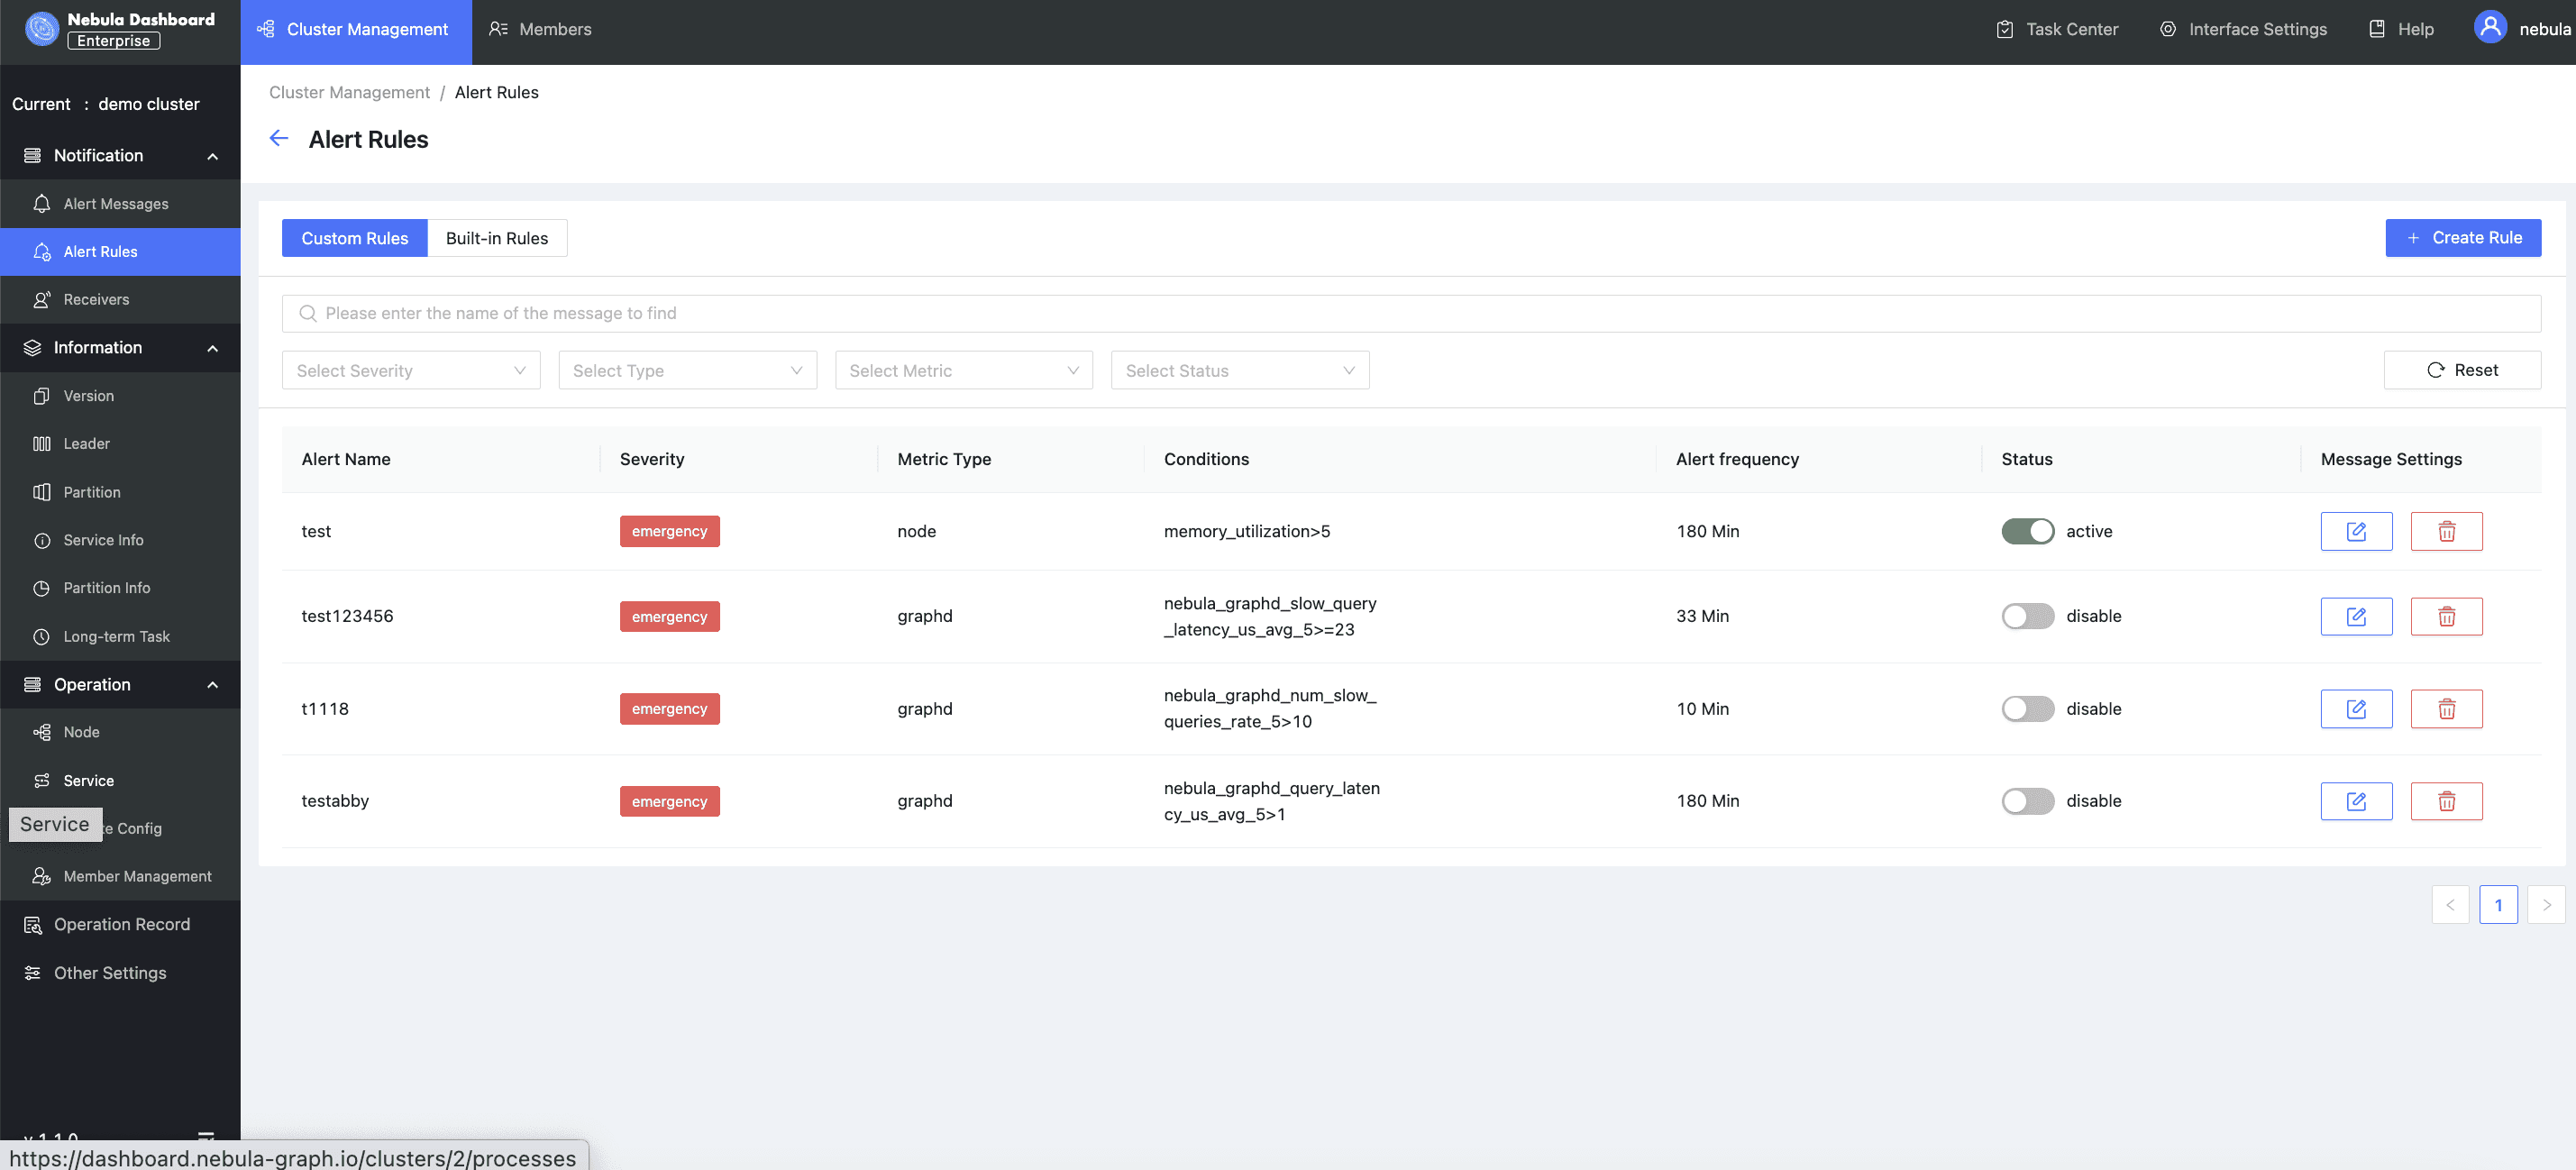
Nebula Dashboard's alert module is a service for alerting the monitoring indicators of NebulaGraph clusters. You can view alert information, set alert rules and alert recipients in the module.
You can set up alert baselines of indicators that you care about, and the frequency and duration of the alert triggering, as well as the notification message template, so that the system will automatically send out notifications to alert you when any of the indicators triggers the corresponding rules.
You can view history alert messages, in-site alert messages, set up email and webhook notifications, and set alert rules in the alert module. Here is how the module works:
Create custom alert rules or activate alert rules.
An alert message will be sent when the system monitors any abnormal metric.
A pop-up in-site message of the alert is shown on the top right of Nebula Dashboard. The system will send out an alert email if you have set an email recipient.
You can then perform troubleshooting based on the alert message.
Fine-grained access control
As a multi-cluster management tool, Nebula Dashboard has enabled a fine-grained access control system to ensure security. Nebula Dashboard has designed two roles, and they are admins and users. While admins are authorized to perform overall configuration of the Dashboard, users are only entitled to operate within the scope that is assigned to them.
LDAP login
Nebula Dashboard supports login with Lightweight Directory Access Protocol (LDAP). Once the LDAP information is provided in the deployment phase, users can log in with their enterprise account. Admins can invite users by sending them an email containing a verification link.
Feature roadmap
Nebula Dashboard is designed to simplify the daily tasks of DevOps engineers and database administrators (DBAs). It will support the following features in the forthcoming versions.
Back up and upgrade a cluster with one click. This feature will only be compatible with NebulaGraph v3.0 and above. Visualized management of Storage Zone TV dashboard that allows you to display key metrics in a customized way in a display in your office Slow query management that allows DBAs to quickly identify slow queries.
Wanna try?
Check out the Nebula Dashboard playground to see how Nebula Dashboard works in practice.. You can also click this link to request a 15-day free trial to test Nebula Dashboard enterprise edition out in your own environment.
If you encounter any problems in the process of using NebulaGraph, please refer to NebulaGraph Database Manual to troubleshoot the problem. It records in detail the knowledge points and specific usage of the graph database and the graph database NebulaGraph.
Join our Slack channel if you want to discuss with the rest of the NebulaGraph community!
