Tech-talk
Understanding LDBC SNB: Schema Generation and Data Generation
The Linked Data Benchmark Council (LDBC) Social Network Benchmark, commonly known as LDBC SNB, is a benchmark test specifically designed to evaluate the performance of graph databases in the context of social networking scenarios.
An Introduction to LDBC
Apart from the Social Network Benchmark, LDBC offers several other benchmark tests, including the Graphalytics Benchmark, Financial Benchmark, and Semantic Publish Benchmark, respectively tailored for graph analysis, finance, and RDF scenarios. The Social Network Benchmark was the first benchmark test proposed by LDBC and has since become the most popular graph database benchmark test worldwide. Notably, as a non-profit organization, LDBC merely provides official audits. The performance of different graph databases may vary due to the operating environment and relevant benchmark parameters.
This article delves into the main components of LDBC SNB: the testing benchmark process, and the preparatory stage of SNB, namely Schema and data generation.
LDBC SNB primarily consists of three main components:
Data Generator: This is a tool for generating large-scale complex data with social network characteristics. The data includes typical social network entities and relationships such as people, posts, comments, geographical locations, organizations, and more.
Interactive Workload: This primarily caters to OLTP, simulating everyday user activities on social networks, such as posting, adding friends, liking, etc. Read requests mainly involve one-to-two-hop queries, possibly accompanied by some write requests.
Business Intelligence Workload: This is primarily for OLAP, simulating in-depth analysis of social network data with whole-graph queries. For example, it analyzes user social behavior, community formation and evolution, and other tasks requiring complex analyses and substantial data processing.
The LDBC SNB paper also refers to an SNB Algorithms component, which as the name suggests, primarily runs graph algorithms like PageRank, community discovery, breadth-first search, etc. However, since the paper was published in 2015 when the scenario was still in its drafting phase at the time, this component has now been moved to the Graphalytics Benchmark.
Furthermore, to run the LDBC SNB test, an official Driver provided by LDBC is required. Different databases need to implement the corresponding Connector based on the Driver's interface to connect the Driver and the database. Subsequently, the Driver generates a Workload, which can be understood as a series of query statements, based on the Benchmark's relevant parameters. It then drives the database under test to execute these query statements, ultimately yielding performance test results.
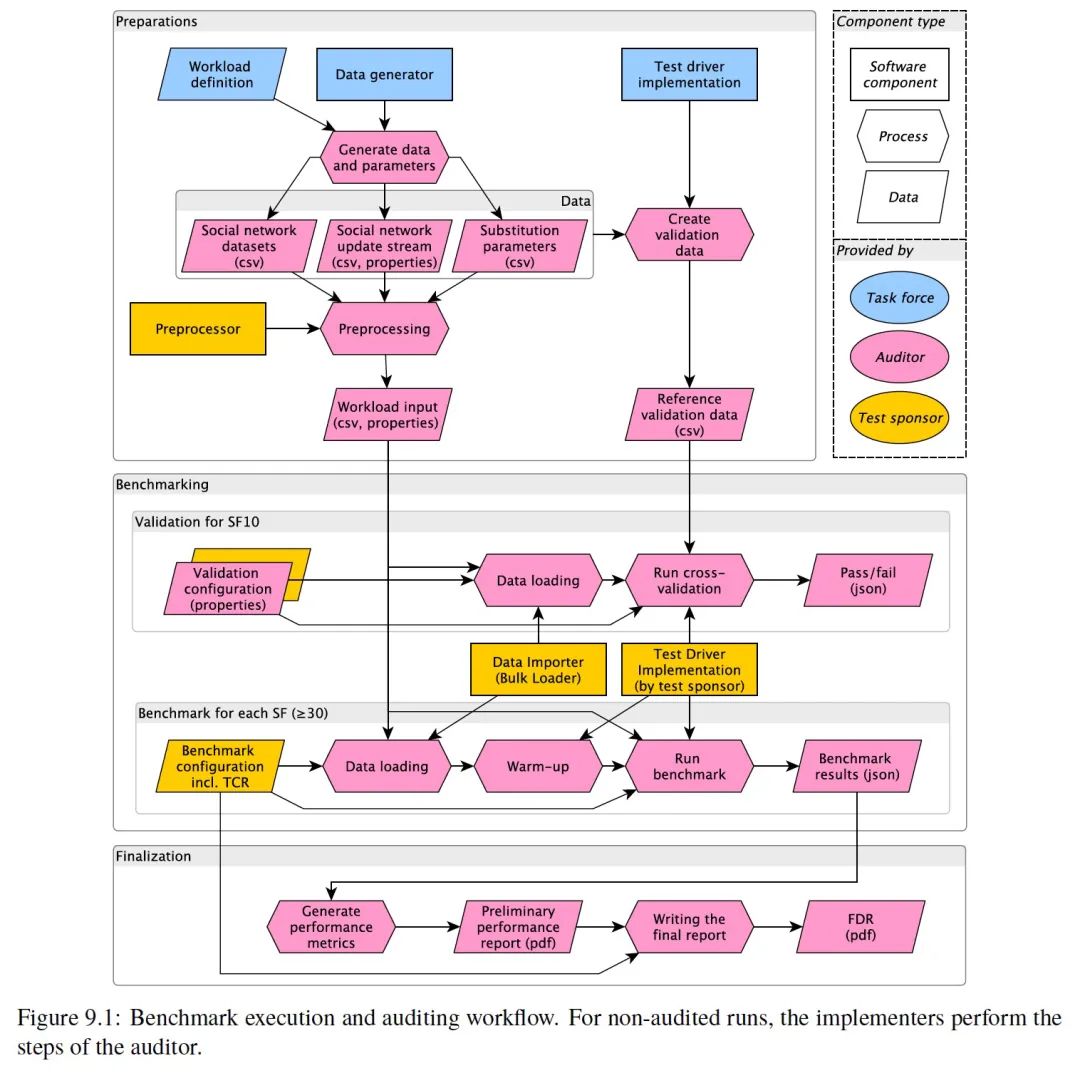
The entire LDBC SNB benchmark testing process is divided into three main stages: the preparation, the benchmark test, and the result output.
During the preparation stage, data generation takes place, which includes the initial import of full data, as well as subsequent real-time updates. In official audits, validation is also required on the SF10 Dataset, which is explained at the end of this article, so this stage also generates data for validation.
The benchmark testing phase begins with validation on the SF10 Dataset, followed by performance testing on the SF30 or SF100 Dataset. The validation process commences after data import, where the Driver, based on a series of queries and expected results prepared in the previous stage, verifies the database's query results to ensure their accuracy. There is no specific time requirement for this validation process. The subsequent performance testing is divided into import, warm-up, and performance testing. The database is allowed a 30-minute warm-up time, while the performance testing must last at least two hours. The test results are then compiled and output.
Generation of LDBC SNB Schema
The data in SNB simulates a social network similar to Facebook, with all data built around the Person entity. A person joins a network. Each Person might have several Forums, within which they can post several Posts. Other people may like some of these Messages. The volume of these elements is mainly influenced by the number of Persons and time:
- A Person with more friends will post more comments or likes.
- Over time, as one makes more friends, the number of comments or likes will also increase.
Some data does not change with the number of the Persons, mainly including some Organizations (mainly schools in this context) and Places (mainly residential cities, countries, and other geographical information). This data plays a role during data generation. For instance, people who attend the same school during the same period are more likely to become friends.
The complete SNB Schema is illustrated in the following diagram:
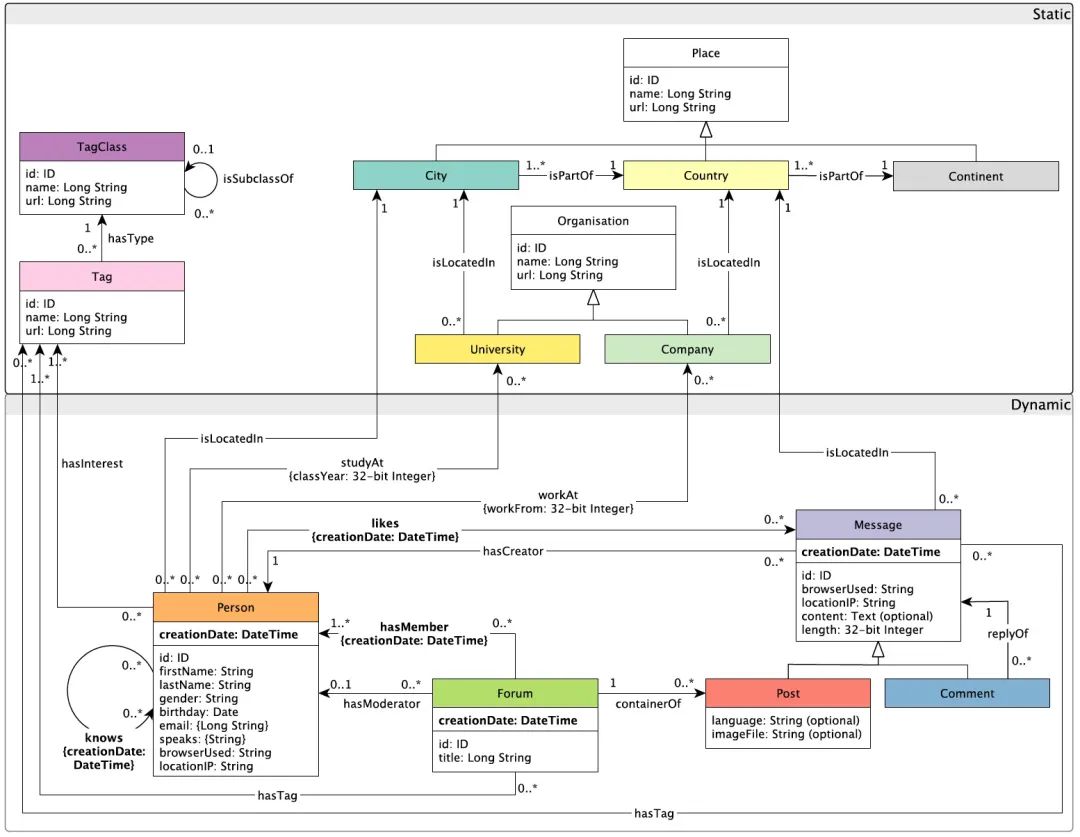
Most graph databases model entities as points and different relationships as edges during testing. However, this is just a convention; the SNB data modeling and the actual database Schema can differ, provided the database can perform the corresponding Workload queries.
Data Generation for LDBC SNB
SNB is the Data Generator (referred to as DataGen), used to generate data that meets the above Schema. The data generated by the Generator is determined by the following three parameters:
- Number of Persons
- Number of years of data to simulate
- The year from which the simulation begins
According to the official documentation, the data generated by DataGen has the following properties:
- Reality: The generated data simulates a real social network. On one hand, the attributes, cardinalities, data correlations, and distributions in the generated data are carefully set to simulate real social networks like Facebook. On the other hand, its original data comes from DBpedia, ensuring the attribute values in the data are authentic and relevant.
- Scalability: DataGen can generate different sizes of datasets (from GB to TB level) for systems of various scales and budgets. Furthermore, DataGen can complete data generation on a single machine or within a cluster.
- Determinism: Regardless of the number of machines used to generate data or the machine configuration, the data generated by DataGen is deterministic and consistent. This essential function ensures that any data system can use the same dataset, guaranteeing fair comparisons between different system environments and repeatable benchmark test results.
- Usability: DataGen is designed to be as easy to use as possible.
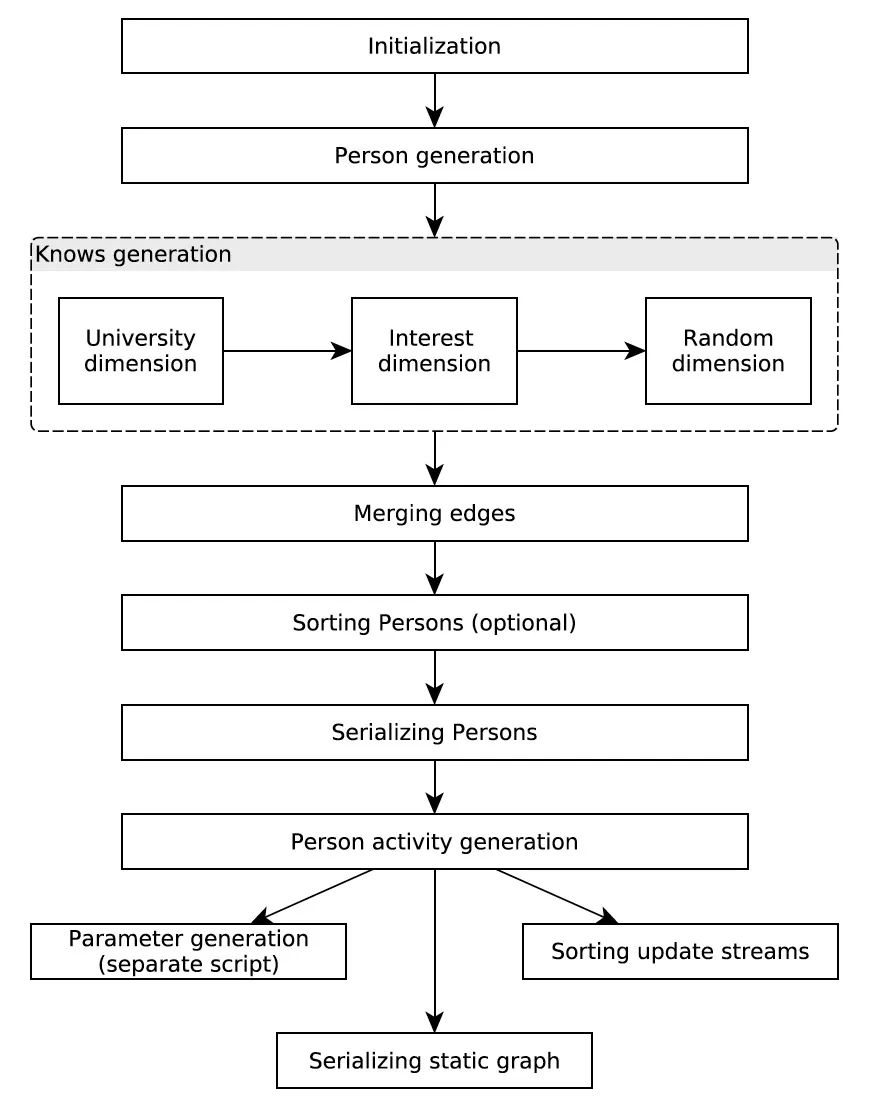
The entire data generation process is illustrated in the following flowchart, which we will break down into several sections for explanation:
Distribution of Attribute Generated
The first step is initialization. The original data used by DataGen comes from DBpedia. For each attribute, DataGen decides the attribute's distribution based on:
- How many possible attribute values there are
- Probability of occurrence of each attribute value
The final distribution of attributes is saved as resource files and DataGen parameters.
Generating Persons and Friendships
As mentioned earlier, the core of the SNB Schema is the Person, which is also reflected in the data generation process. DataGen generates all Persons, and some of the information needed for subsequent operations in Person, such as how many Friendships each Person has (this value is crucial, its distribution follows a Power law), the university attended by the Person, the company where the Person works, etc.
Then, DataGen creates the Friendship relationships, i.e., the 'knows' in the flowchart, for each Person. Just like in real social networks, people with the same interests or behaviors are likely to connect. To simulate such a social network, SNB considers the following three dimensions when generating Friendships:
- The university attended by the Person, the time of attendance, and the city where the university is located
- The Person's interests
- Each Person generates a random value, and the closer the random values, the more similar they are (this is to simulate that not all friends are made through university and interests)
These three dimensions account for 45%, 45%, and 10% of the weight of each Person's Friendship relationships, respectively. This divides the process of building edges between Persons into three sub-steps.
DataGen sorts all Persons according to three dimensions (sorted by one dimension at a time) and then divides the sorted Persons into multiple disjoint parts, distributed to different Worker processes. Even after division, the Persons a Worker thread is responsible for might exceed the memory size. Therefore, the Worker thread maintains a sliding window, where the probability of establishing Friendship relationships between Persons within the sliding window follows a geometric distribution.
As shown in the figure below.
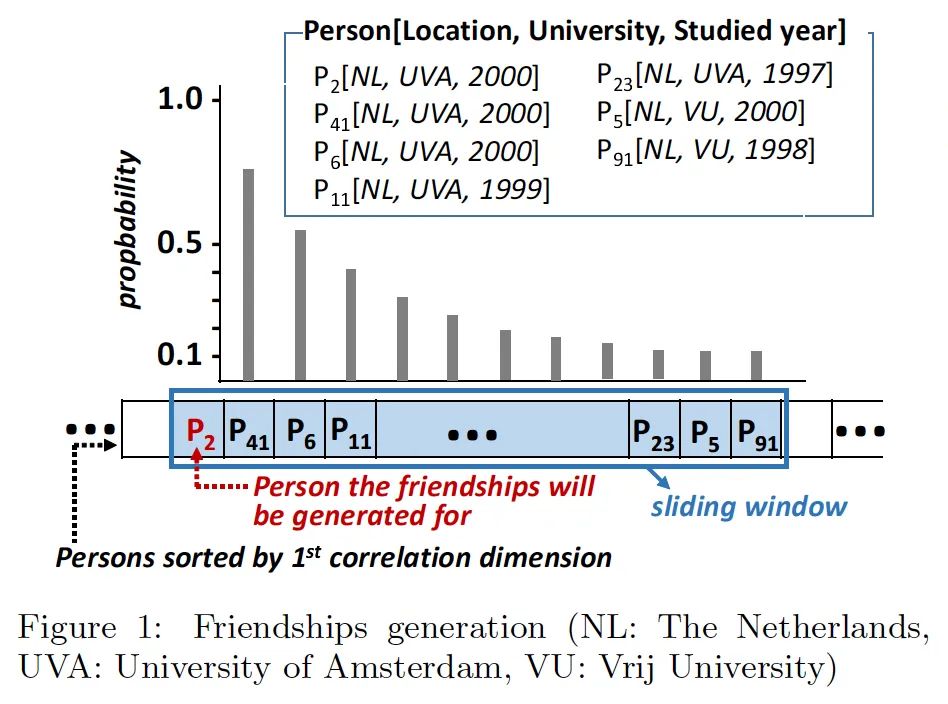
Suppose we've sorted by the university attendance dimension, resulting in an ordered sequence of Persons. The Worker then maintains a sliding window, generating Friendship relations each time for the person at the far left of the sliding window (P2 in the figure). The proportion of other people in the window establishing Friendship with the first person follows a geometric distribution. Once the first person in the sliding window has established enough Friendships, the starting point of the sliding window moves to the next person.
Note: The specifics of the sliding window size, geometric distribution parameters, and even random generator parameters are not delved into here. It's unclear how DataGen handles situations where it's impossible to generate enough Friendships within the sliding window.
After sorting, distributing, and establishing edges by the sliding window for all three dimensions, DataGen moves to the next stage.
Generating Social Activities
After generating Persons and Friendships, DataGen starts to generate each Person's social activities, including Forums, Posts, and Comments. Some correlations exist in this data:
- Persons with more Friendships are more active on social networks.
- Each Person is more likely to Post or Comment in Forums related to their interests or the university they attended.
- Social activities are related to time; for example, discussions related to football surge near the World Cup.
Final Output
After the above steps, DataGen completes data generation. The simulated social network graph is in two parts:
- Dataset: 90% of the data is for initial import.
- Update Streams: 10% of the data is for subsequent real-time updates.
In addition, it generates parameters (mainly starting points) for subsequent Workload requests. We'll explain parameter generation in detail in the next article, but here we'll briefly describe the SNB read request Workload. Interactive Workload queries primarily aim to get results within one second. All read queries start from a point in the graph, obtaining a small part of the subgraph information. Also, as different starting points have different degrees of input and output, this essentially determines the data volume accessed by this read request.
To test different systems and scenarios, SNB defines a scale factor (SF) to control the final data volume size. For instance, the original data size of SF1 is 1 GB, while the sizes of SF0.1 and SF300 are 100 MB and 300 GB, respectively. The amount of vertex-edge data of different scale factors is shown in the table below.
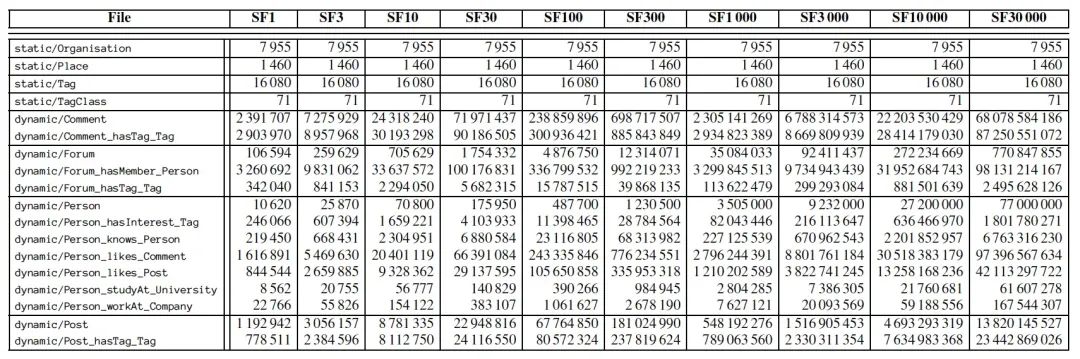
The final generated Dataset is divided into two main categories: Static and Dynamic, both formatted in CSV. Depending on the number of threads configured in DataGen, the final generated data will also be divided into multiple fragments. Static includes Organizations, Places, Tags, etc., all of which are static data generated based on DBpedia. The number of these does not change with the scale factor. In other words, this data is independent of the number of Persons. The Dynamic part mainly includes Persons, knows (the Friendship described in the data generation section), Forums, Posts, and Comments, etc.
Update Streams contain all update operations, mainly simulating real-time actions such as registering new users, commenting, liking, adding friends, and more.
Reference
We have now roughly completed the introduction to the preparation stage. We will elaborate on the parameters generated at the end of the preparation stage in the next article when we discuss Workload. For further reading and detailed understanding, refer to
- the LDBC Social Network Benchmark Specification
- ldbc-snb-interactive-sigmod-2015.pdf (ldbcouncil.org)