Tech-talk
What are Graph Algorithms? And How to Use Them?
NebulaGraph supports a rich set of graph algorithms, efficiently transforming hidden relationships into actionable insights. This blog will introduce you to graph algorithms, NebulaGraph Algorithms, and explore how users are using these algorithms in production environments and how to get started.
Graph Databases and Graph Algorithms
What is a “Graph”?
Imagine you have a network, vertex represents an independent entity and edges represent the relationships between these entities. This structure consisting of vertices and the edges connecting them is called a “graph”.
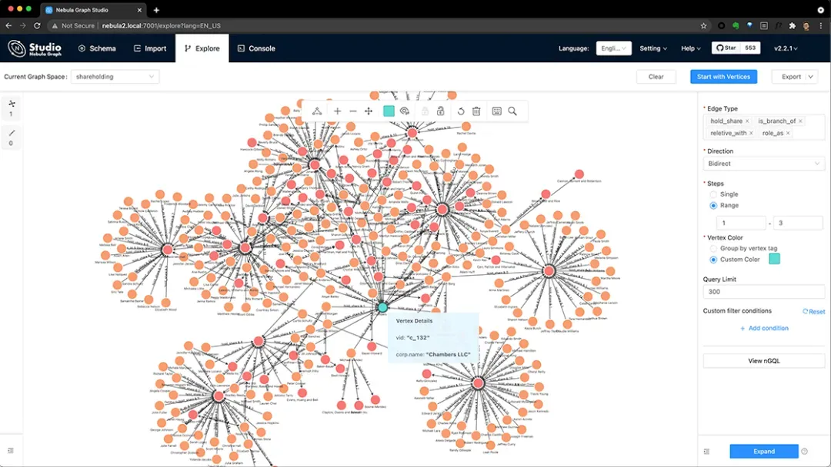
Fig.1 Using NebulaGraph Studio to Analyze a Company’s Equity
What is a Graph Algorithm?
Graph algorithm is a set of smart “problem-solving ideas” or “toolkits” that are specifically used to analyze the relationship network composed of “points” and “lines” and calculate problems about this network.
Why Do We Need Specialized “Graph Algorithms”?
- Beyond Simple Queries: Traditional queries find immediate neighbors, but graph algorithms can analyze the structure and dynamics of the entire network.
- Quantify the Value of Relationships: Transform vague “associations” into calculable indicators (such as importance, closeness, and similarity).
- Discover Hidden Patterns: Automatically identify communities, key hubs, and communication paths that are difficult to query using traditional relational databases.
Applications of Graph Algorithms
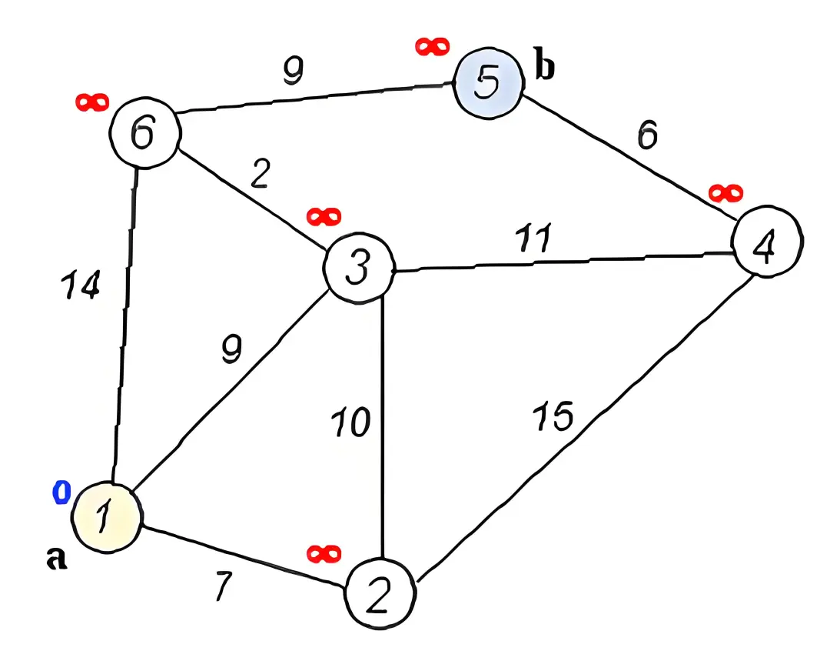
- Find the Shortest Path:
- Question: When navigating from home (point A) to workplace (point B), how does the navigation plan the fastest or lowest cost route?
- Graph Algorithm: The classic shortest path algorithm (such as Dijkstra algorithm) can quickly calculate the path with the smallest total weight (usually representing distance length, travel time or comprehensive cost) among all possible routes from A to B.
- Question: How does Instagram, X, or Facebook know who you might know and recommend friends to you?
- Graph Algorithms: Common neighbor-based link prediction algorithms (such as the Jaccard algorithm) analyze your social network, focusing on your direct friends (first-degree neighbors) and then examining their friends (second-degree neighbors). People with whom you have many common friends (first-degree neighbors) but with whom you are not yet connected are likely to be recommended to you.
- Page Rank:
- Question: How do search engines decide which web pages should appear first when you search for “graph algorithms”?
- Graph Algorithm: PageRank algorithm. Its core idea is:
- Web pages (points) that are pointed to by many other web pages are usually more important (have more scores).
- A web page pointed to by an important web page will also gain higher importance (an important vote has more weight).
- The algorithm will continuously calculate the “importance score” of each web page, and the ones with higher scores will be ranked higher.
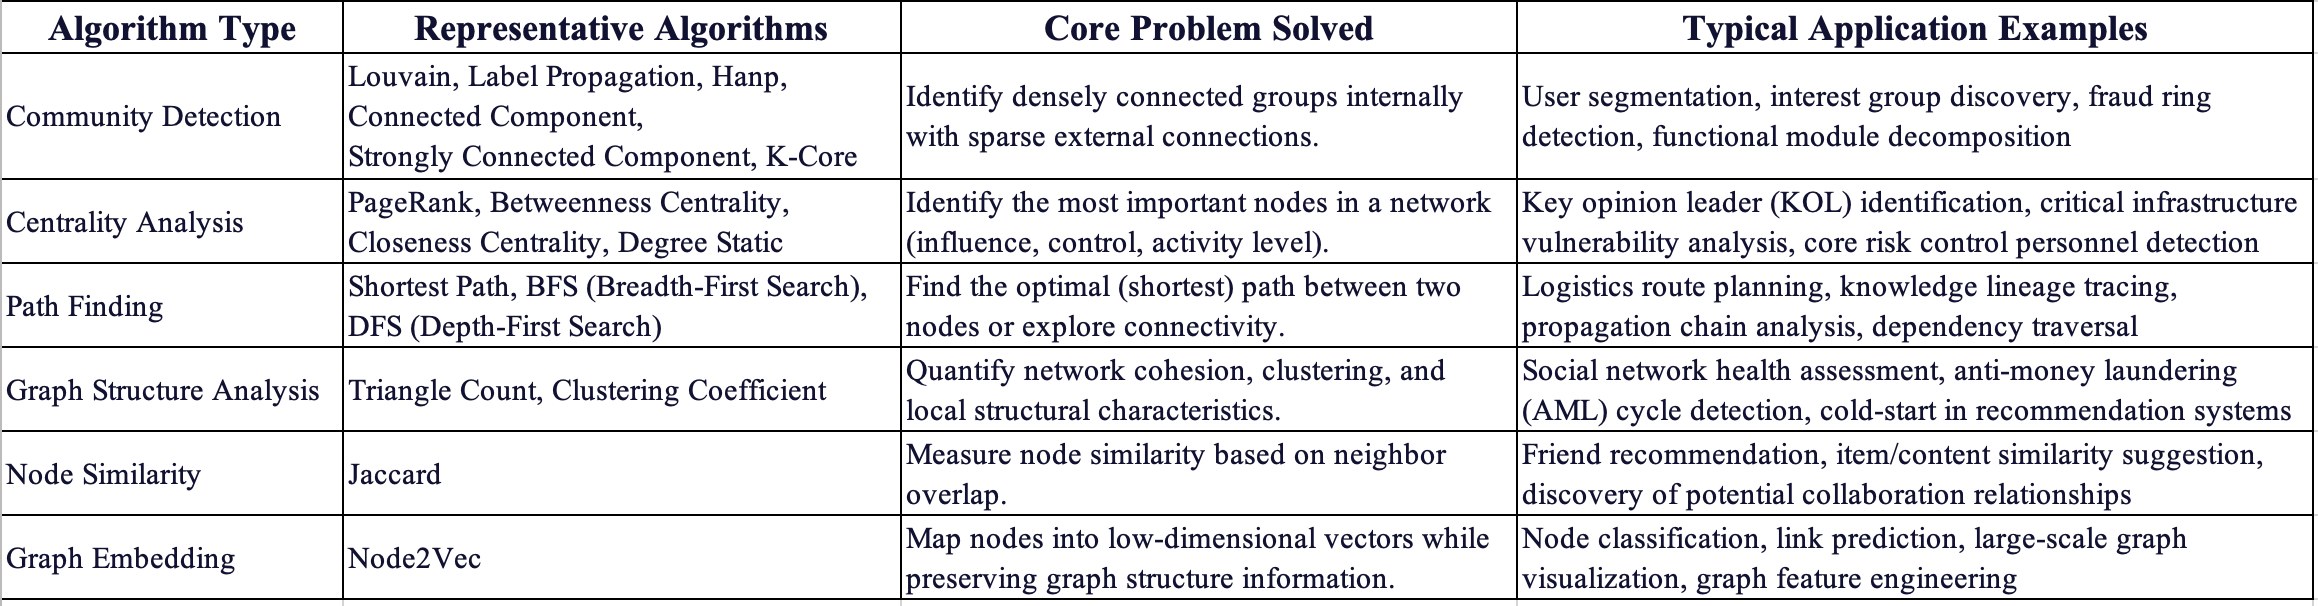
Graph Algorithm Types and Application Scenarios
Graph algorithms can be broadly categorized into the following types:
Graph Algorithms Supported by NebulaGraph
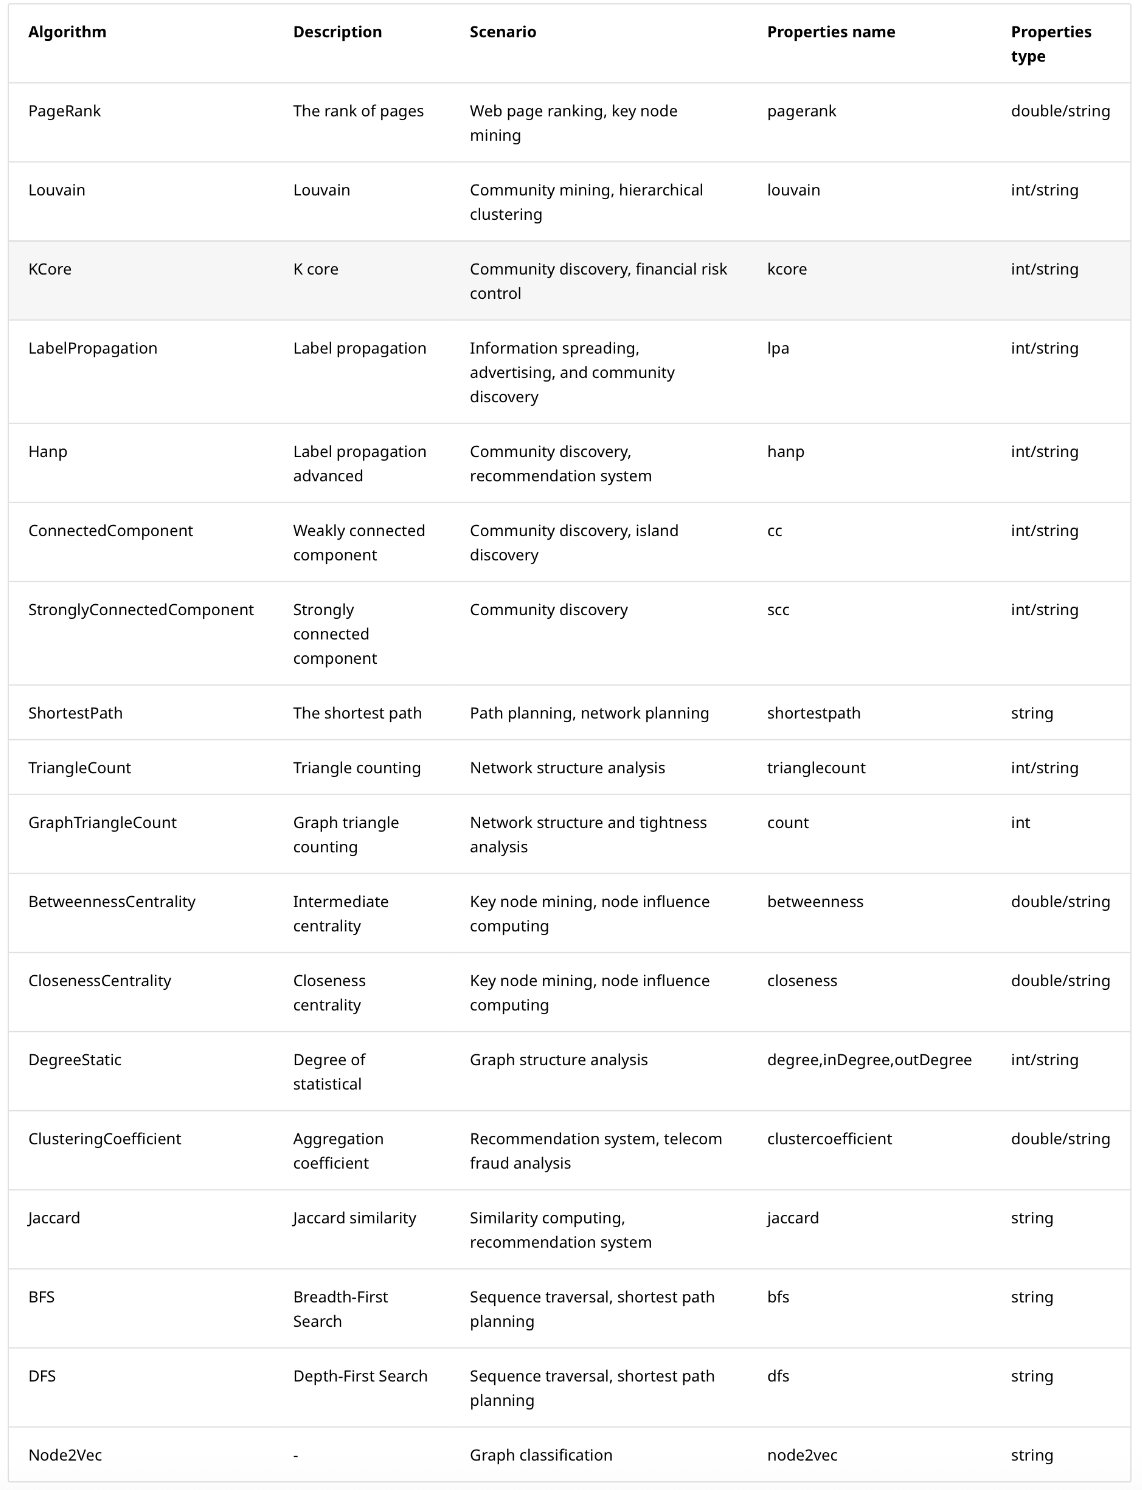
The above figure shows the basic graph algorithms, and the enterprise version of NebulaGraph supports more high-performance algorithms, such as InfoMap, APSP, DegreeWithTime, HyperANF, etc., and custom graph algorithms based on ISO-GQL.
Note: When writing the algorithm results into the NebulaGraph, make sure that the tag in the corresponding graph space has properties names and data types corresponding to the table above.
How to Use NebulaGraph Algorithm
How do NebulaGraph users unlock business value with graph algorithms?
- Centrality Analysis – PageRank
When to Use: When you need to find the most influential or widely cited/connected nodes in the entire network.
Scenario Examples: Identifying key opinion leaders on social media; locating core transit accounts in financial transaction networks.
Use Case: Boss Zhipin (leading recruitment platform in Asia) integrated three data sources: trace, metrics, and logs, to construct a unified, full-link anomaly topology map. They discovered multiple true subgraphs scattered throughout the graph structure, each with a “storm center”. Therefore, they used the PageRank algorithm to dynamically calculate node failure weights (rank values are weighted by node in-degree, link error count, and events). This algorithm identified the TopN faulty nodes with the highest rank values, enabling rapid root cause identification with an average convergence time of just 20 seconds.
- Community Discovery - Louvain, Hanp
When to Use: When you need to discover hierarchical community structures in large-scale networks.
Scenario Examples: Division of interest groups in social networks; segmentation of e-commerce user groups (similar purchasing patterns); and zoning of urban traffic flow.
Use Case: China Mobile first built a relationship network based on all mobile users and used the Louvain and Hanp algorithms to discover and mine communities, such as individual credit scores and relationships between individuals. It then scored the community to identify whether it is a fraudulent community or a low-credit community, thereby conducting risk management.
- Community Discovery-Label Propagation
When to Use: When you need to quickly discover communities, or when the network structure is clear and the community boundaries are distinct.
Scenario Examples: Identifying user interest circles in real-time recommendation systems; group segmentation along news/information dissemination paths.
Use Case: At ZhongAn Insurance, Label Propagation was used in the loan processing phase. Label Propagation primarily propagated information from a specific point Y and derived related points. For example, if a user on the loan processing list is severely overdue, this user becomes point Y, labeled as overdue. Based on established risk control rules, the system checks which points associated with point Y exhibit similar overdue behavior, thereby determining whether these points belong to a community with severe overdue payments.
- Connected Component/Strongly Connected Component
When to Use: CC (weakly connected components) cares about whether paths are connected (ignoring edge direction). That is used to detect isolated islands. SCC (strongly connected components) cares about whether paths are reachable from each other via directed paths. That is used to analyze tight cyclic dependencies.
Scenario Examples: Analyzing isolated user groups in social networks (CC); identifying research schools in a paper’s citation network (SCC); analyzing circular dependencies between system modules (SCC).
Use Case: ZhongAn Insurance used Connected Component to calculate a user relationship graph. When an unusual number of people (e.g., 50 or 60) mark a mobile phone number as a “family contact”, that number and its associated users constitute a potentially risky community. Being in such an unusual community is a strong signal (sufficient, but not necessary) that the user is at risk, and the user may also be implicated due to relatives involved in illegal activities. Based on this, ZhongAn conducted preliminary risk control flagging and in-depth verification of users within the community.
Graph algorithms turn connected data into actionable insights—from finding key nodes to uncovering hidden patterns. The real value starts when you apply them to your own data.
Ready to explore? Platforms like NebulaGraph provide the scalable foundation to run these analyses and discover what your data truly knows. Start experimenting today!