Use-cases
Detect Corona Virus Spreading With Graph Database Based on a Real Case

Background
This post will detect the corona virus spreading based on a real case that took place in Tianjin, China. In this case, there are five confirmed cases of the nCOV pneumonia in the same shopping mall in Tianjin. From the initial three cases, it seems that there is no epidemiological correlation. Against such background, how to uncover the links among the cases?
Evidences have shown the nCOV transmitted from person to person. I.e., if extracted the transmission in graph model, a person transmitted to one another through an edge (Demo 1). Consider that A infects B, then B infects C, then C to D… This makes the tree-like path (Demo 2). However, given cross-infection, repeated use of the public places and transportation, the spreading path of the virus becomes a network structure. Thus a graph database is the best choice to store and explore the transmission relations. In this post, we will discuss how the nCOV disease spreads and who are the possible suspected cases.

Tianjin Case Introduction
Let us use Usr1, Usr2, Usr3, Usr4, Usr5 to refer to these five cases, and look at their tracks:
Usr1: caught a fever on January 24, worked in Area A of the shopping mall from January 22 to January 30, diagnosed on January 31.
Usr2: Usr2 is the husband of Usr1. He had diarrhea on January 25 and was diagnosed on February 1.
Usr3: Usr3 contacted a suspected case on January 18, then worked in Area B of the shopping mall. He started fever on January 24, and was diagnosed on February 1.
Usr4: Usr4 contacted with suspected cases on January 12 and 13, and then worked in Area C of the shopping mall. He started fever on January 21 and was diagnosed on February 1;
Usr5: Visited the shopping mall Area A, B, and C from 16 to 22 pm on January 23, then started to fever January 29. Diagnosis on February 2.
Graph Model Extraction
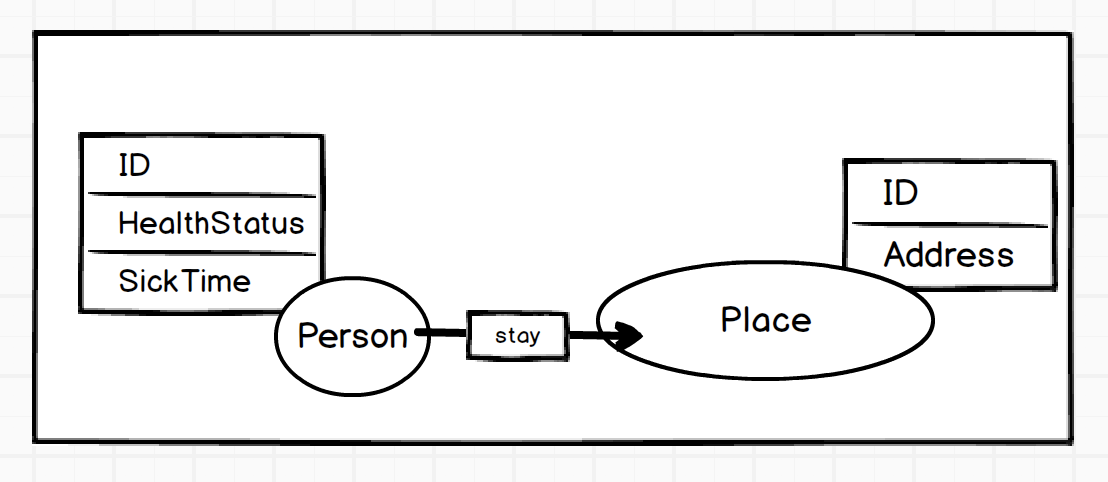
Based on the above introduced data, we extract a data model with two vertex types, i.e. Person and Space, one edge, i.e. stay.
Properties in Person:
- _ID_: unique identification of a person
- _HealthStatus_:
- Health
- Sick
- _ConfirmedTime_: used to trace the order of the patients' onset
Properties in Space:
- _ID_: unique identification of a space
- _Address_: space address
Properties in Stay:
- start_time
- end_time

Data Importing
Based on the above model (the figure below), we can import data. Then with the help of NebulaGraph, we can find out the source of the virus, and who should be observed / isolated after the diagnosis of a patient.

Usr1:
- Person: ID 2020020201, HealthStatus: Sick, ConfirmedTime: 20200124;
- Stay Time: start_time: 2020-01-23 12:00:00, end_time: 2020-01-23 18:00:00;
- Place: Shopping mall Area A
- Stay Time: start_time: 2020-01-23 18:00:00, end_time: 2020-01-24 8:00:00;
- Place: Community A in Hepin District
Usr2:
- Person: ID 2020020202, HealthStatus: Sick, ConfirmedTime: 20200125;
- Stay Time: start_time: 2020-01-23 12:00:00, end_time: 2020-01-23 23:00:00;
- Place: Shopping mall Area A
Usr3:
- Person: ID 2020020203, HealthStatus: Sick, ConfirmedTime: 20200125;
- Stay Time: start_time: 2020-01-23 15:00:00, end_time: 2020-01-23 19:00:00;
- Place: Shopping mall Area B
- Stay Time: start_time: 2020-01-23 12:00:00, end_time: 2020-01-23 23:00:00;
- Place: Community B in Hexi District
Usr4:
- Person: ID 2020020204, HealthStatus: Sick, ConfirmedTime: 20200121;
- Stay Time: start_time: 2020-01-23 11:00:00, end_time: 2020-01-23 20:00:00;
- Place: Hotpot restaurant in Nankai District
- Stay Time: start_time: 2020-01-23 20:00:00, end_time: 2020-01-23 23:00:00;
- Place: Community B in Binhai District
Usr5:
- Person: ID 2020020205, HealthStatus: Sick, ConfirmedTime: NULL;
- Stay Time: start_time: 2020-01-23 11:00:00, end_time: 2020-01-23 15:00:00;
- Place: Hotpot restaurant in Nankai District
- Stay Time: start_time: 2020-01-23 16:00:00, end_time: 2020-01-23 23:00:00;
- Place: Shopping mall Area A, B and C
Import the above data into NebulaGraph to build relationships among persons and places. Take Usr1 as example:
-- Insert Usr1
INSERT VERTEX person(ID, HealthStatus, ConfirmedTime) VALUES 1:(2020020201, ‘Sick’, '2020-01-24');
-- Insert place
INSERT VERTEX place(name) VALUES 101:("Shopping mall Area A")
-- Insert edge
INSERT EDGE stay (start_time, end_time) VALUES 1 -> 101: ('2020-01-23 12:00:00', '2020-01-23 18:00:00')
-- Insert another place
INSERT VERTEX place(name) VALUES 102:("Community A in Hepin District")
-- Insert another edge
INSERT EDGE stay (start_time, end_time) VALUES 1 -> 102: ('2020-01-23 18:00:00', '2020-01-24 8:00:00')
Data Analysis on Confirmed Cases
Together, let's uncover the mystery of Usr1 infection step by step.
1. Find out where Usr1 was on January 23
$PlaceUsr1Goto = GO FROM 1 OVER stay WHERE stay.start_time > '2020-01-23 15:00:00' AND
stay.start_time < '2020-01-23 23:00:00'
YIELD stay._dst AS placeid
2. Check if Usr1 exposed to any confirmed cases during this time
GO FROM $PlaceUsr1Goto OVER stay REVERSELY WHERE $$.person.HealthStatus == 'Sick'
   AND $$.person.ConfirmedTime <= "2020-01-23"
It is strange that at the time of Usr1's onset (2020-01-24), there was no fever in the people he contacted. Could it be that these people have come into contact with other patients (thus becoming carriers)? Let us continue our analysis.
3. Check who have an undirected connection with Usr1
$PersonUsr1Meet = GO FROM $PlaceUsr1Goto OVER stay REVERSELY YIELD stay._dst AS id
$PlaceThosePersonGoto = GO FROM $PersonUsr1meet.id OVER stay YIELD stay.start_time AS start
    stay.end_time AS end
GO FROM $PlaceThosePersonGoto.id FROM stay REVERSELY
    WHERE $$.person.HealthStatus == 'Sick'
    AND $$.person.ConfirmedTime <= "2020-01-23"    -- become sick before this time
    stay.start_time > $PlaceTHosePersonGoto.start
    AND stay.end_time < $PlaceThosePersonGoto.end  -- have connected
We found that Usr1 had connection with Usr2, Usr5 between 12:00 on January 23 and 8:00 on January 24. Both of the two were healthy at that time. But Usr5 had previously contacted the patient Usr4 with a fever.
So far, we have found the spreading path:
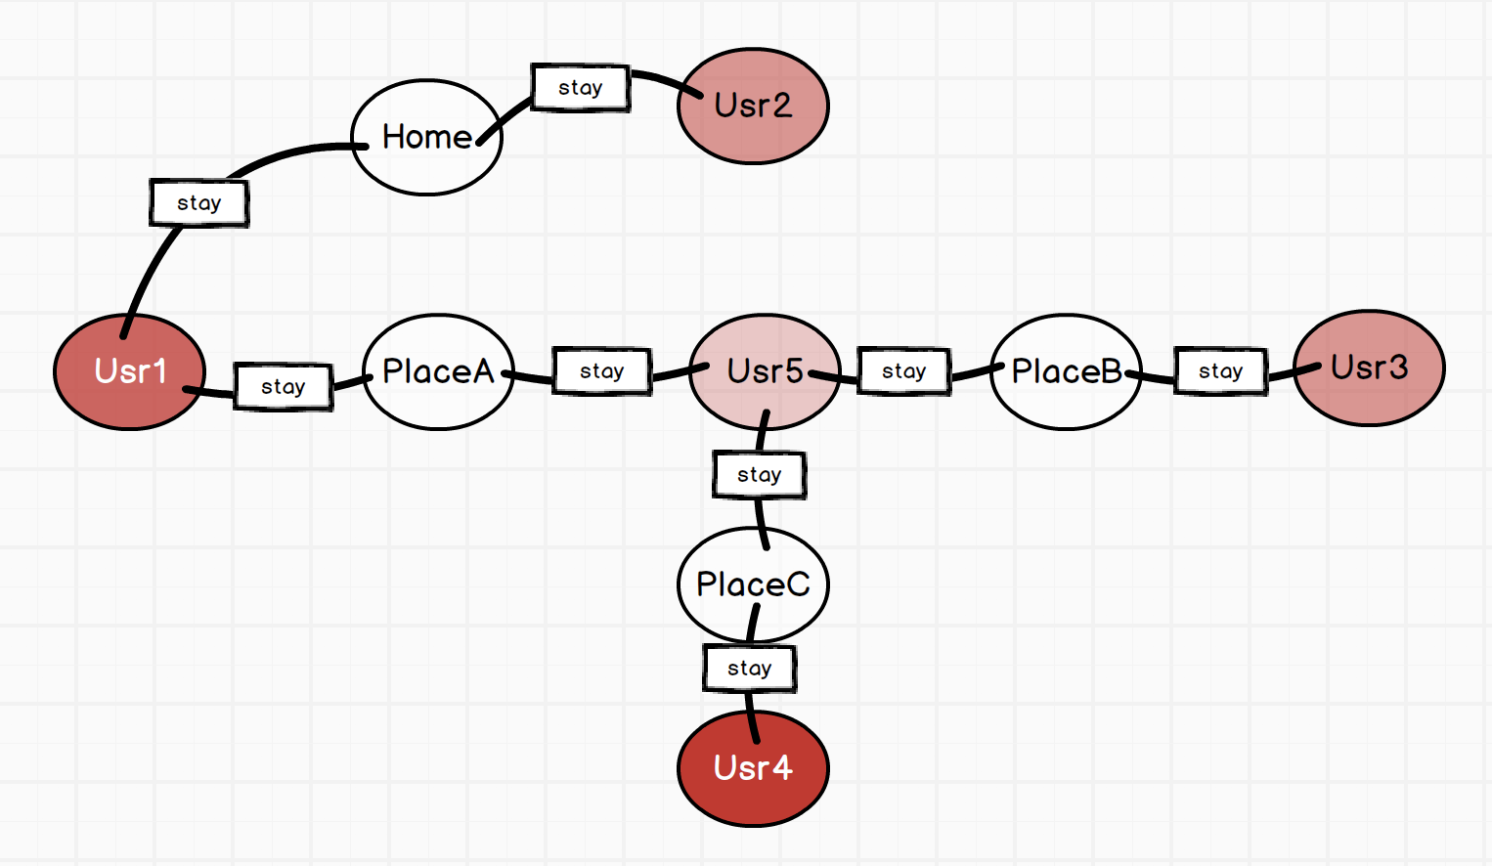
Usr4 became sick on January 21. After being sick, he went to a hot pot restaurant in Nankai District, Tianjin (11:00-20:00 on January 23). Here he was exposed to (then healthy) Usr5 (11-15 pm on January 23), making Usr5 a carrier during contact. Then Usr5 headed to Tianjin shopping mall A, B, and C area (16:00-23:00 on January 23). During this time, he transmitted the virus to Usr1 who worked in area A (12:00-18:00 on January 23). And Usr1 became sick on January 24.
4. Find out who needs to be isolated
After Usr1 is diagnosed, we need to see where and when she has been to and who was in contact with her in the same place during this time period. People that were exposed to her need close observation and isolation.
GO FROM 1 OVER stay YIELD stay.start_time AS usr1_start,
stay.end_time AS usr1_end, stay._dst AS placeid
| GO FROM $placeid OVER stay REVERSELY WHERE
stay.start_time > usr1_start AND stay.start_time < usr1_end
YIELD $$.person.ID
We can see that Usr1 and Usr2 have connected with each other in a Community A in Heping District, Tianjin, which made Usr2 a suspicious case.
Visualization of the spreading path
The following figure shows the visualization of the above analysis.

Of course, if you want to observe large amount of vertices, such as tens of millions of potential people and their second and third propagation trajectories, a program with batch queries will be more efficient.
Summary
The Spring Festival travel rush and other causes lead to the wide spreading of the nCov. We noted from social media that all the communities, villages, businesses are adopting extremely stringent quarantine and asking people to report daily whereabouts and health status. Both the quarantine and track of billion people request huge resources in time and money.
But such self-report mechanism is inefficient and unreliable, especially there are always cases of concealing behavior and medical history. This may lead to failure in timely isolation and treatment, and also impose negative affect on business.
Fortunately, the development of big data has facilitated the construction of the data system in security, transportation, medical departments. In the above Tianjin case, we used a few cases to demonstrate how graph database helps to locate suspicious cases and decrease the risk of infection.


