Use-cases
20-Second Root Cause Identification: BOSS Zhipin Builds Intelligent Operations and Maintenance Based on NebulaGraph
In today’s hyper-connected digital world, ensuring system resilience is an important business necessity. For platforms like BOSS Zhipin, Asian leading job-matching app with millions of monthly active users, even minutes of downtime can erode user trust and impact revenue. The platform relies on a complex web of services, hosts, databases, and network infrastructure. Yet, like many fast-scaling companies, BOSS Zhipin faced a challenge: traditional monitoring tools were failing to keep up with the complexity of their architecture.
Enter NebulaGraph, the open-source, distributed graph database that’s helping BOSS Zhipin transform reactive firefighting into proactive, intelligent operations.
The Operational Challenges Behind Rapid Growth
BOSS Zhipin revolutionized online recruitment with its “direct hiring” model — enabling real-time communication between job seekers and recruiters. But behind the seamless user experience lies a sprawling, multi-team, polyglot tech stack with intricate service dependencies.
As the platform scaled, their O&M team hit a breaking point:
- Data Silos: Metrics, logs, traces, and events lived in separate tools, making correlation nearly impossible.
- High MTTR: Root cause analysis (RCA) relied on tribal knowledge, leading to long mean time to recovery (MTTR) and engineer burnout.
In short, they were diagnosing system-wide outages with fragmented, secondhand information — a recipe for instability.
Why Graph? Because Systems Are Graphs
The team realized that modern cloud-native systems are fundamentally graphs — services calling services, containers running on hosts, databases tied to networks. Trying to model this with tables or trees was like mapping a neural network with spreadsheets.
They needed a database that could:
- Handle billions of nodes and edges (services, instances, dependencies)
- Support real-time, complex traversals (e.g., “Find all upstream services affected by this DB latency”)
- Scale horizontally and remain highly available
- Allow flexible schema evolution as the system grows
Technology Selection
| Dimension | Neo4j | NebulaGraph | Impact on Root Cause Localization |
|---|---|---|---|
| Data Model | Supports flexible property graph models | Also supports property graphs, with customizable properties, labels, and edge types; the model better aligns with actual business structures | Both can meet modeling requirements. However, NebulaGraph provides clearer management of labels and edge types, making it more suitable for maintaining large-scale business graphs. |
| Performance & Scalability | Single-node/cluster edition, suitable for medium-sized data volumes | Native distributed architecture with strong horizontal scalability, supporting tens of millions of nodes and billions of edges | In root cause localization scenarios, NebulaGraph can easily handle future growth. |
| Query Language | Cypher: Strong semantic expression capability, low learning cost | nGQL: Low learning cost, supports graph computation expressions | Both are powerful, but nGQL is closer to engineering practices. |
| Temporal Capabilities | Not good at handling time-series data | Supports multi-version storage of edges (TimeRank) mechanism | In root cause analysis, service dependencies and performance metrics have clear temporal correlations. NebulaGraph's TimeRank support is crucial. |
| Ecosystem & Integration | Rich ecosystem, mature tools and community | Rapidly growing ecosystem, compatible with Spark, Flink, Prometheus, Grafana, etc. | NebulaGraph is better suited for Boss Zhipin system in terms of cloud-native and observability integration. |
| Operations & Cost | Community edition has limited features; enterprise license is costly | Fully open-source, low resource consumption, simple deployment | NebulaGraph has lower costs, which facilitates centralized middleware construction and horizontal rollout. |
After evaluating options like Neo4j, they chose NebulaGraph — a distributed graph database built for scale, performance, and production-grade reliability.
“NebulaGraph wasn’t just faster — it was the only solution that could model our entire infrastructure as a living, breathing dependency graph.” — Wan Jiafei, SRE Engineer at BOSS Zhipin
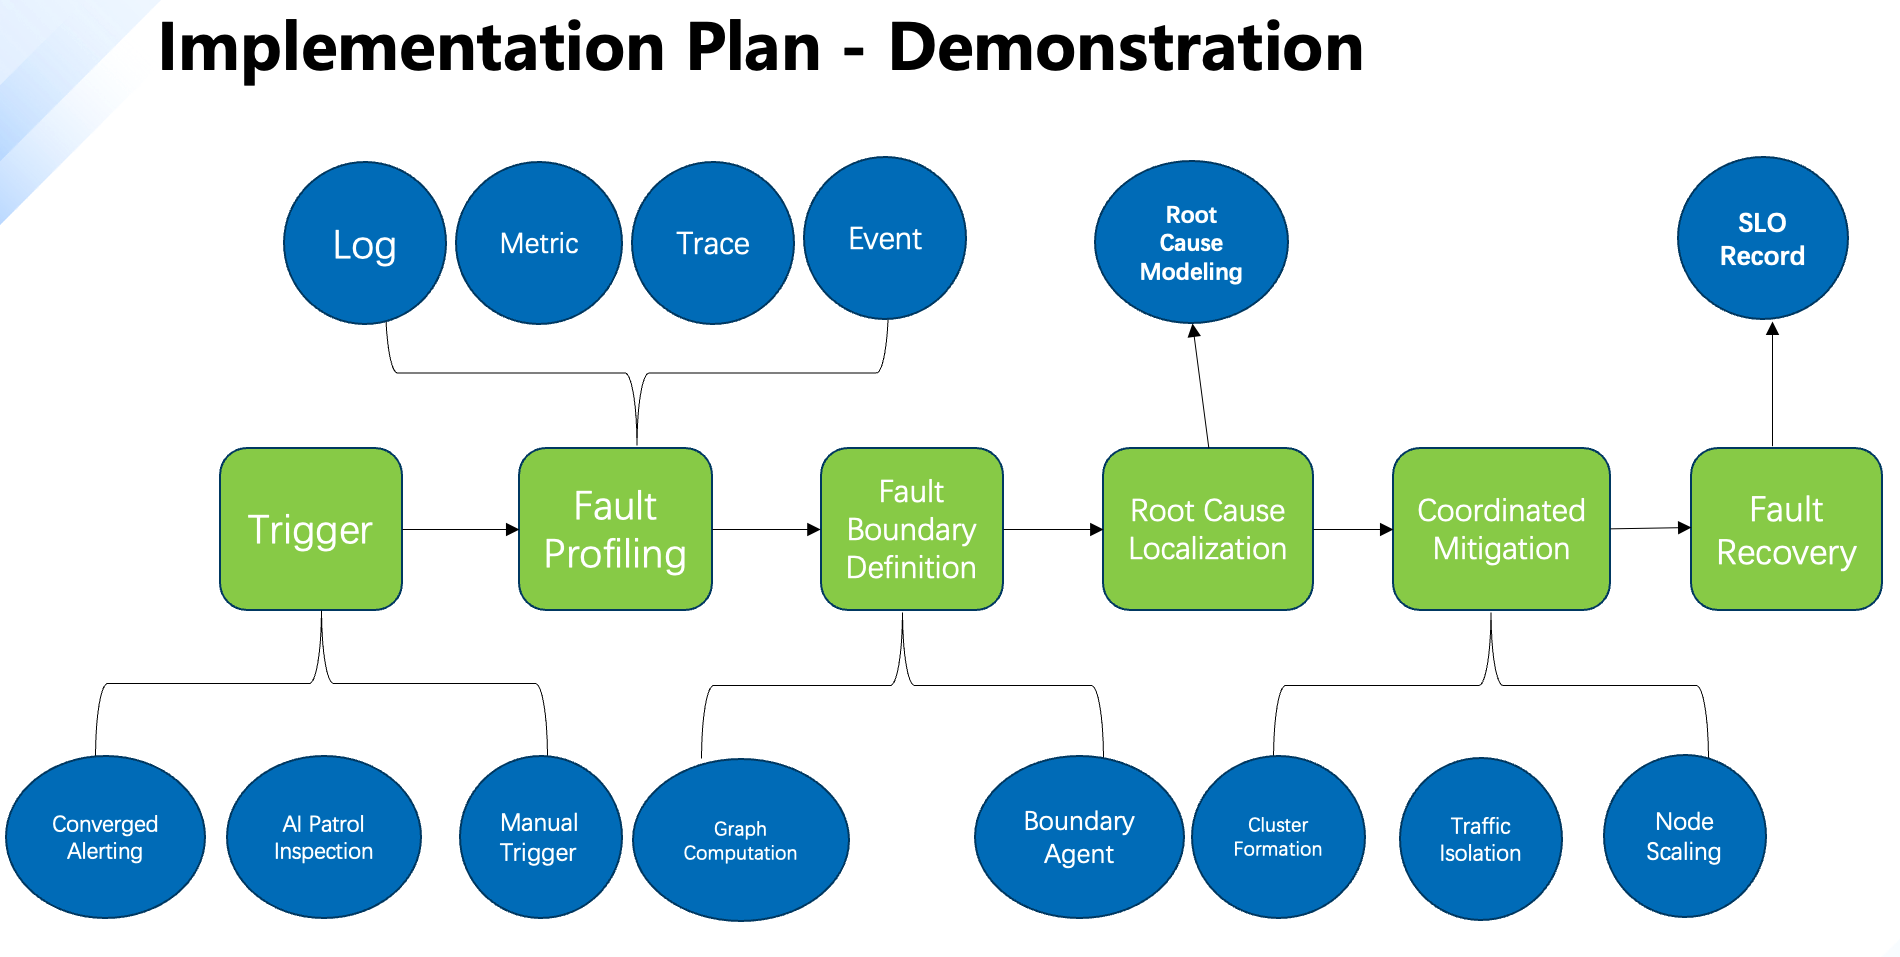
Building the Intelligent RCA Engine with NebulaGraph
After completing the technology selection, BOSS Zhipin built a complete root cause location mechanism based on NebulaGraph, focusing on “how to transform complex fault problems into structured graph problems”, covering the four core parts of modeling, collection, calculation and display.
Multi-Layer Dependency Modeling
They started by modeling the system across multiple dimensions:
- Horizontal layer: Service-to-service call relationships (HTTP, RPC, SQL)
- Vertical layer: Dependencies between applications and infrastructure (VMs, databases, gateways)
- Root cause dimension: Abstraction of potential failure sources (e.g., configuration changes, resource exhaustion)
- Time-series modeling: Using NebulaGraph’s multi-version edges (TimeRank) to track performance changes over time
Data Collection and Graph Data Construction
In terms of data acquisition, the system connects multiple key data sources for operation and maintenance, including:
- Trace/Span: service call chain tracing information
- Metric: Performance metrics from Prometheus, JVM, etc.
- Log/Event: log and alarm events
- Infra information: host, container, and middleware resource status.
Data from traces (Trace/Span), metrics (Prometheus, JVM), logs, events, and infrastructure metadata was collected via Kafka, enriched, and loaded into NebulaGraph as a property graph — where edges carry latency, error rates, and timestamps.
Graph Algorithms for Smarter RCA
With a clear graph model, BOSS Zhipin implemented a graph-driven root cause analysis process on NebulaGraph:
- Impact Propagation Analysis: Traversing upstream dependencies to find blast radius
- PageRank-Based Scoring: Nodes with high in-degree and error spikes are ranked as top root cause candidates
- Visualized Fault Chains: Automatically generating a “root cause → service → user impact” path
Use PageRank Algorithm to Dynamically Calculate Node Failure Weight
By integrating the three major data sources of link tracking, system indicators, and logs, a unified full-link anomaly topology map was constructed. It was found that multiple true subgraphs appeared scattered in the graph structure, and each subgraph had a “storm center.”
- Graph Algorithm-Driven Positioning
- Calculation: Rank value is calculated by weighting the node in-degree, link error number, and events.
- Output: TopN faulty nodes with the highest Rank values
- Association Analysis
Use graph relationships to divide related queues (direct fault nodes) and non-related queues (indirectly affected nodes) to accurately narrow the scope of investigation.
In one case, a network port failure cascaded through a host to an auth-service — NebulaGraph identified the true root cause (network device) in under 20 seconds, not the “storm center” (auth-service) that traditional tools would flag.
The Results: 20-Second Root Cause
The impact of BOSS Zhipin’s graph-powered operations system has been transformative.
Mean Time to Recovery (MTTR) has been reduced by over 70%, enabling faster resolution of critical incidents. Incident triage is now 90% faster, allowing engineers to identify and act on root causes within seconds. With a unified, graph-based view of the system, engineers spend significantly less time switching between disparate tools and correlating data manually.
As a result, post-mortem analyses have shifted from being anecdotal to fully data-driven, improving accountability, accuracy, and long-term system resilience.
Implementation Plan - Benefits
Strictly following the three stages of fault response to reduce Mean Time To Recovery (MTTR)
| Fault Stage | Duration (Max/Avg) | Response Measures |
|---|---|---|
| Fault Detection | 1 min (average convergence time: 20s) | Fault localization, quickly identify root cause |
| Fault Handling | 5 min (average response time: 40s) | Coordinate responsible personnel based on root cause to develop mitigation plan |
| Fault Recovery | 10 min (average response time: 2 min) | Activate mitigation measures and restore services |
The Future: Graph + AI = Autonomous Operations
BOSS Zhipin isn’t stopping at RCA. They’re building toward autonomous operations with:
- Data Agents: AI assistants that analyze graph patterns to surface hidden anomalies
- Root Cause Agents: LLM-powered bots that correlate logs, traces, and topology to predict failures
- Precomputed Subgraphs: Caching common traversal patterns for instant insights
This is the promise of AIOps 2.0 — not just automation, but intelligent, context-aware decision-making powered by graph.
BOSS Zhipin’s journey shows that with the right data model — and the right database — you can turn chaos into clarity, and minutes into seconds.
As systems grow more distributed and ephemeral, traditional monitoring tools are hitting their limits. Graph databases like NebulaGraph are becoming essential infrastructure for observability, SRE, and platform engineering.