Deployment
Apr 27, 2023
Memory Tracker: Memory Management Practice in NebulaGraph Database
NebulaGraph
Memory management in databases is an important module in database kernel design, and measurable and controllable memory is an important guarantee for the stability of the database. Similarly, memory management is also crucial for NebulaGraph Database. The multi-degree association query feature of graph databases often leads to a huge demand for memory in the execution layer of graph databases. This article mainly introduces the new feature Memory Tracker in NebulaGraph v3.4, aiming to achieve fine-grained control of memory usage by the Memory Tracker module, reduce the risk of system OOM kill for graphd and storaged, and improve the kernel stability of NebulaGraph database.
Available Memory
Before diving into Memory Tracker, let's introduce some relevant background knowledge: available memory.
Process Available Memory
Here, we briefly introduce how the system determines available memory under various modes.
Physical Machine Mode
The database kernel reads the system directory /proc/meminfo to determine the actual memory and available memory in the current environment. Memory Tracker takes "actual physical memory" as the "maximum memory that the process can use".
Container/cgroup Mode
In the nebula-graphd.conf file, there is a configuration item FLAG_containerized to determine whether the database is running in a container. After setting FLAG_containerized (false by default) to true, the kernel reads the files under the relevant cgroup path to determine how much memory the current process can use. There are two versions of cgroup - v1 and v2, and v2 is used as an example here.
FLAG | Default Value | Explanation |
|---|---|---|
FLAG_cgroup_v2_memory_max_path | /sys/fs/cgroup/memory.max | Determine the maximum memory usage by reading the path |
FLAG_cgroup_v2_memory_current_path | /sys/fs/cgroup/memory.current | Determine the current memory usage by reading the path |
For example, to control the memory quota for graphd and storaged on a single machine separately, follow these steps::
Step 1:Set FLAG_containerized=true;
Step 2:Create /sys/fs/cgroup/graphd/,/sys/fs/cgroup/storaged/,and configure memory.max under their respective directories;
Step 3:Add relevant configuration in etc/nebula-graphd.conf,and etc/nebula-storaged.conf
Memory Tracker Available Memory
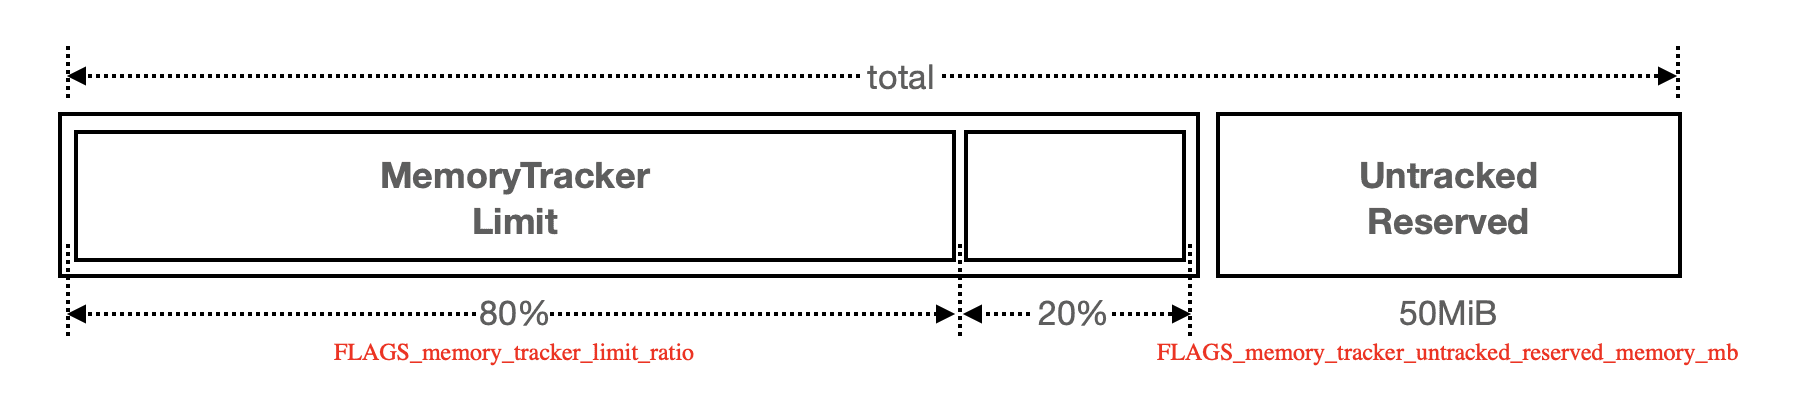
After obtaining the "process available memory", the system needs to convert it into memory that Memory Tracker can track. There is a conversion formula between "process available memory" and "Memory Tracker available memory".
FLAG | Default Value | Explanation | Dynamic Change |
|---|---|---|---|
memory_tracker_untracked_reserved_memory_mb | 50 M | Memory Tracker manages memory allocated through new/delete, but there may be other ways a process consumes memory besides this method; for example, by calling low-level malloc/free. Memory not tracked by this flag is subtracted during calculations. | Yes |
memory_tracker_limit_ratio | 0.8 | Memory Tracker allows you to specify the proportion of memory it can use. In some scenarios, we may need to reduce this value to prevent out-of-memory (OOM) issues. | Yes |
Here we'll elaborate on the usage of memory_tracker_limit_ratio:
In a mixed deployment environment where multiple graphd or storaged instances are deployed together, it needs to be reduced. For example, if graphd only occupies 50% of the memory, you need to manually change it to 0.5 in
nebula-graphd.conf;Value range: In addition to the (0,1] value range for
memory_tracker_limit_ratio, there are two special values defined:2:Dynamically adjusts available memory based on the current system runtime environment as perceived by the database kernel. This method is not real-time and may have some degree of inaccuracy;3:The limit will be set to an extremely large value, effectively disabling Memory Tracker;
How Memory Tracker is Designed and Implemented
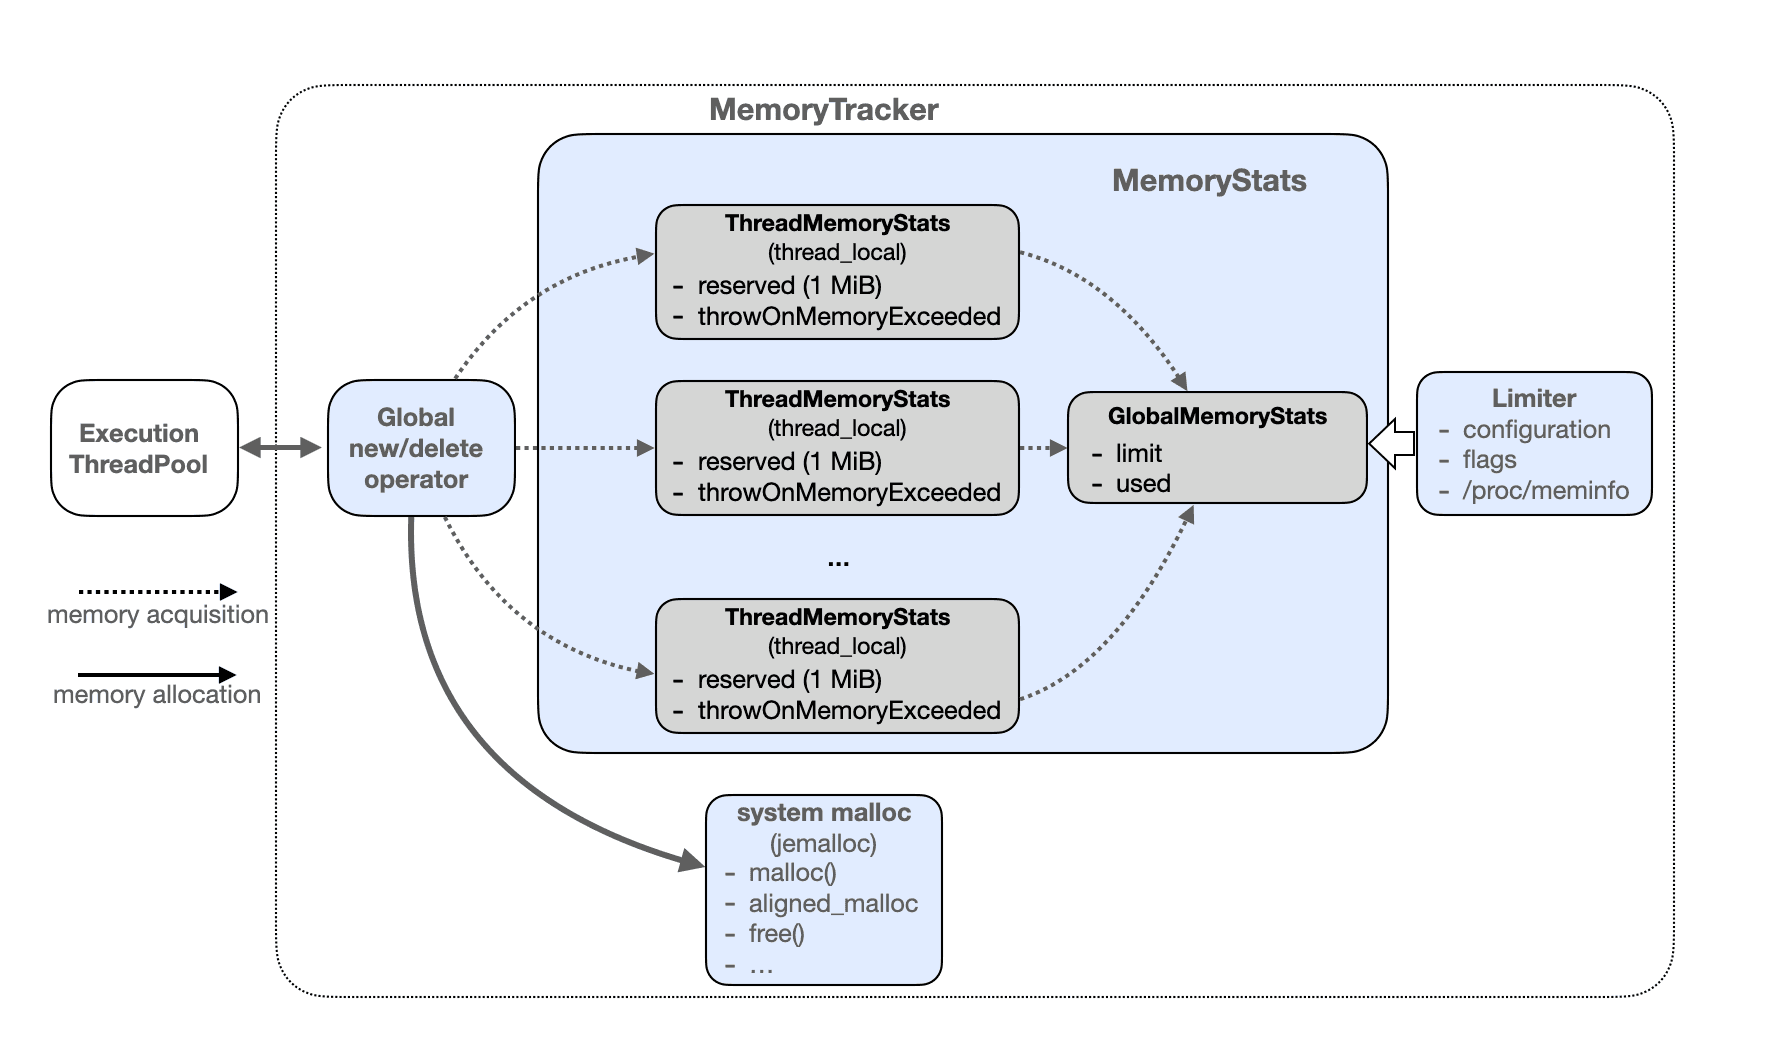
Next, let's discuss the design and implementation of Memory Tracker. The overall Memory Tracker design consists of several sub-modules, including Global new/delete operator, MemoryStats, system malloc, and Limiter. In this section, we'll focus on the Global new/delete operator and MemoryStats modules.
Global new/delete operator
Memory Tracker overloads the global new/delete operator, taking control of memory allocation and deallocation, allowing memory quota allocation management before actual memory allocation takes place. This process is broken down into two steps:
Step 1: Report memory allocation through MemoryStats;
Step 2: Invoke jemalloc for actual memory allocation behavior;
jemalloc:Memory Tracker does not change the underlying malloc mechanism, still using jemalloc for memory allocation and deallocation.
MemoryStats
Global memory usage statistics are managed through GlobalMemoryStats and ThreadMemoryStats for global memory and thread-internal memory, respectively;
ThreadMemoryStats
thread_local variable, execution engine threads maintain their MemoryStats in their ThreadMemoryStats, including "memory Reservation information" and "whether to allow exceptions to be thrown on memory exceeded";
Reservation
Each thread reserves a 1 MB memory quota to avoid frequent requests to GlobalMemoryStats for quota. When applying or returning, ThreadMemoryStats will use a larger memory block as the exchange unit with the global scope.
alloc:
Only when the locally reserved 1 MB memory is used up, will it ask the global scope for the next 1 MB. This approach is used to minimize the frequency of requesting memory quota from the global scope;
dealloc:
The returned memory is first added to the thread's reserved memory, and when the reserve quota exceeds 1 MB, 1 MB is returned, and the rest is kept;
throwOnMemoryExceeded
Whether to throw an exception when the thread exceeds the memory quota. Only when throwOnMemoryExceeded is set to true will throw std::bad_alloc occur. See the Catch std::bac_alloc section for scenarios where throw std::bad_alloc needs to be disabled.
GlobalMemoryStats
Global memory quota, maintaining limit and used variables.
limit:limit: Calculated from the runtime environment and configuration information, it represents the maximum memory Memory Tracker can manage. Limit serves the same purpose as the Limiter module. For detailed memory conversion, see the "Memory Tracker Available Memory" section above;
used:Atomic variable, summarizing all reported used memory from threads (including reserved portions). If used + try_to_alloc > limit, and when
throw OnMemoryExceededis set to true,std::bad_allocexception will be thrown.
Catch std::bac_alloc
Since Memory Tracker overloads new/delete and affects all threads, including third-party threads, throwing bad_alloc may cause unintended behavior in some third-party threads. To prevent such issues, we use an active memory detection approach in the code path, enabling memory detection in operators, RPC modules, etc.
Memory detection in operators
In graph/storage operators, add try...catch (performing calculations/allocating memory in the current thread) and thenError (asynchronously submitting calculation tasks via folly::Executor) to detect Memory Tracker throwing std::bad_alloc.
The database then returns an error code through Status, causing the query to fail; When debugging memory, you can enable the FLAGS_memory_tracker_detail_log configuration item in the nebula-graphd.conf file and reduce the memory_tracker_detail_log_interval_ms to observe memory usage before and after the query;
folly::future asynchronous execution
Synchronous execution
Memory detection in RPC
RPC mainly addresses memory quota control issues during the serialization/deserialization of Request/Response objects. Since storaged responses are all encapsulated in the DataSet structure, the problem is transformed into memory detection during DataSet serialization and deserialization.
Serialization: DataSet object construction is in the NebulaGraph operator result return logic, and by default, memory detection is enabled;
Deserialization:Explicitly enabled through MemoryCheckGuard, exceptions can be caught in StorageClientBase::getResponse's onError;
Error Codes
To help identify which module has issues, NebulaGraph has added relevant error codes, indicating memory exceeded exceptions in graphd and storaged respectively:
