Technical Deep Dives
Mar 14, 2023
Distributed Cloud-Native Graph Database with NebulaGraph Docker Extension
Ajeet Singh Raina, Wey Gu
This ariticle was written by Ajeet Singh Raina and Wey Gu, originally published on Docker blog.
Graph databases have become a popular solution for storing and querying complex relationships between data. As the amount of graph data grows and the need for high concurrency increases, a distributed graph database is essential to handle the scale.
Finding a distributed graph database that automatically shards the data, while allowing businesses to scale from small to trillion-edge-level without changing the underlying storage, architecture of the service, or application code, however, can be a challenge.
In this article, we’ll look at NebulaGraph, a modern, open source database to help organizations meet these challenges.
Meet NebulaGraph
NebulaGraph is a modern, open source, cloud-native graph database, designed to address the limitations of traditional graph databases, such as poor scalability, high latency, and low throughput. NebulaGraph is also highly scalable and flexible, with the ability to handle large-scale graph data ranging from small to trillion-edge-level.
NebulaGraph has built a thriving community of more than 1000 enterprise users since 2018, along with a rich ecosystem of tools and support. These benefits make it a cost-effective solution for organizations looking to build graph-based applications, as well as a great learning resource for developers and data scientists.
The NebulaGraph cloud-native database also offers Kubernetes Operators for easy deployment and management in cloud environments. This feature makes it a great choice for organizations looking to take advantage of the scalability and flexibility of cloud infrastructure.
Architecture of the NebulaGraph database
NebulaGraph consists of three services: the Graph Service, the Storage Service, and the Meta Service (Figure 1). The Graph Service, which consists of stateless processes (nebula-graphd), is responsible for graph queries. The Storage Service (nebula-storaged) is a distributed (Raft) storage layer that persistently stores the graph data. The Meta Service is responsible for managing user accounts, schema information, and Job management. With this design, NebulaGraph offers great scalability, high availability, cost-effectiveness, and extensibility.
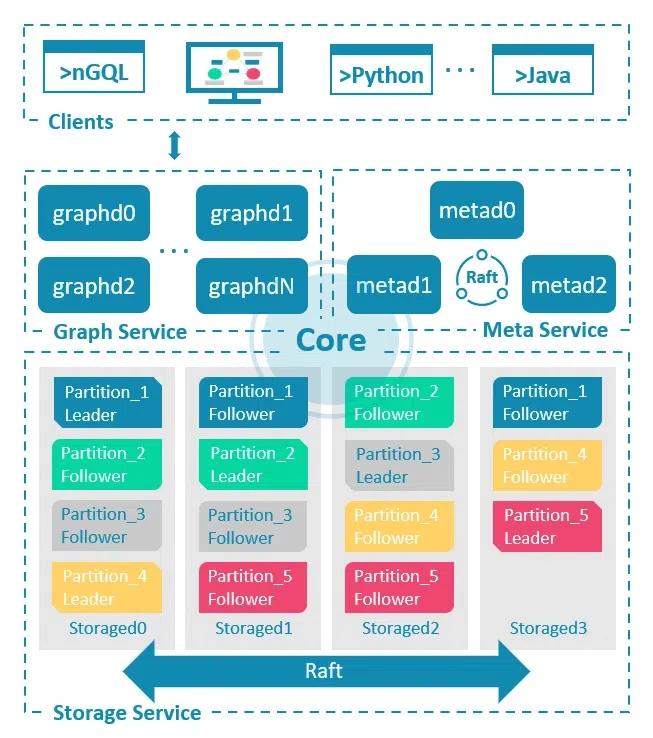
Figure 1: Overview of NebulaGraph services.
Why NebulaGraph?
NebulaGraph is ideal for graph database needs because of its architecture and design, which allow for high performance, scalability, and cost-effectiveness. The architecture follows a separation of storage and computing architecture, which provides the following benefits:
Automatic sharding: NebulaGraph automatically shards graph data, allowing businesses to scale from small to trillion-edge-level data volumes without having to change the underlying storage, architecture, or application code.
High performance: With its optimized architecture and design, NebulaGraph provides high performance for complex graph queries and traversal operations.
High availability: If part of the Graph Service fails, the data stored by the Storage Service remains intact.
Flexibility: NebulaGraph supports property graphs and provides a powerful query language, called Nebula Graph Query Language (nGQL), which supports complex graph queries and traversal operations.
Support for APIs: It provides a range of APIs and connectors that allow it to integrate with other tools and services in a distributed system.
Why run NebulaGraph as a Docker Extension?
In production environments, NebulaGraph can be deployed on Kubernetes or in the cloud, hiding the complexity of cluster management and maintenance from the user. However, for development, testing, and learning purposes, setting up a NebulaGraph cluster on a desktop or local environment can still be a challenging and costly process, especially for users who are not familiar with containers or command-line tools.
This is where the NebulaGraph Docker Extension comes in. It provides an elegant and easy-to-use solution for setting up a fully functional NebulaGraph cluster in just a few clicks, making it the perfect choice for developers, data scientists, and anyone looking to learn and experiment with NebulaGraph.
Getting started with NebulaGraph in Docker Desktop
Setting up
Prerequisites: Docker Desktop 4.10 or later.
Step 1: Enable Docker Extensions
You’ll need to enable Docker Extensions under the Settings tab in Docker Desktop. Within Docker Desktop, confirm that the Docker Extensions feature is enabled (Figure 2). Go to Settings > Extensions and select Enable Docker Extensions.
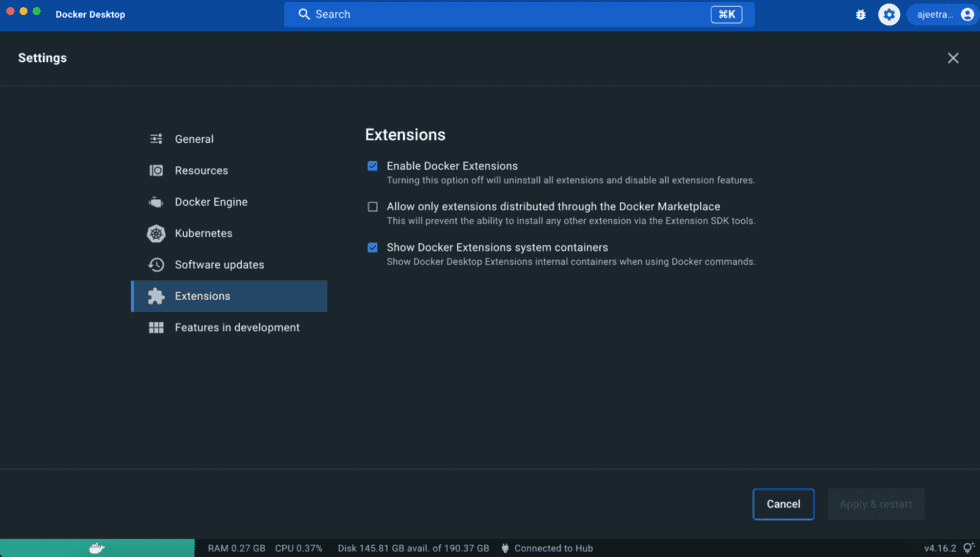
Figure 2: Enabling Docker Extensions within the Docker Desktop.
All Docker Extension resources are hidden by default, so, to ensure its visibility, go to Settings > Extensions and check the Show Docker Extensions system containers.
Step 2: Install the NebulaGraph Docker Extension
The NebulaGraph extension is available from the Extensions Marketplace in Docker Desktop and on Docker Hub. To get started, search for NebulaGraph in the Extensions Marketplace, then select Install (Figure 3).
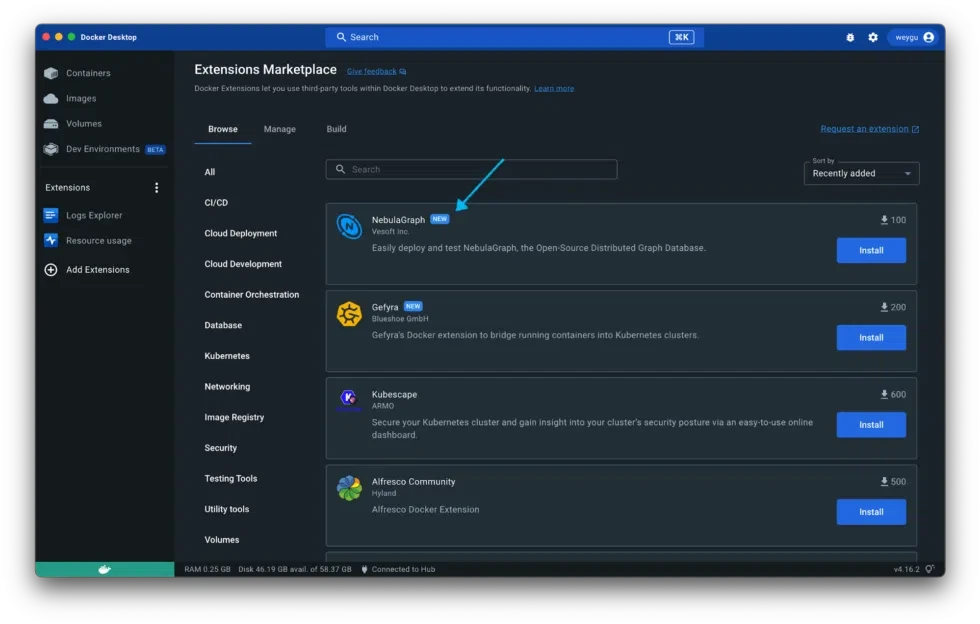
Figure 3: Installing NebulaGraph from the Extensions Marketplace.
This step will download and install the latest version of the NebulaGraph Docker Extension from Docker Hub. You can see the installation process by clicking Details (Figure 4).
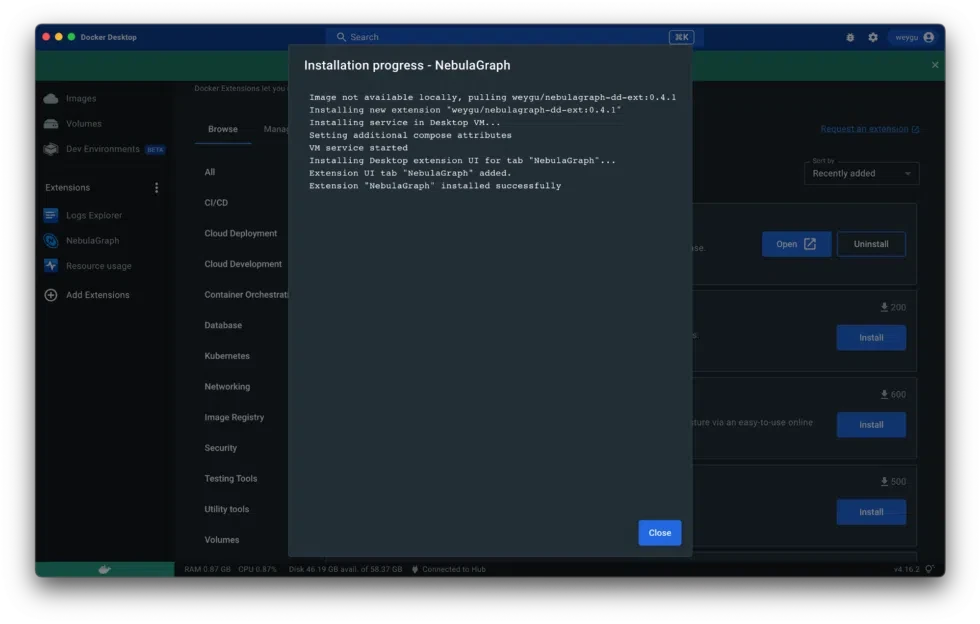
Figure 4: Installation progress.
Step 3: Waiting for the cluster to be up and running
After the extension is installed, for the first run, it normally takes fewer than 5 minutes for the cluster to be fully functional. While waiting, we can quickly go through the Home tab and Get Startedtab to see details of NebulaGraph and NebulaGraph Studio, the WebGUI Utils.
We can also confirm whether it’s ready by observing the containers’ status from the Resources tab of the Extension as shown in Figure 5.
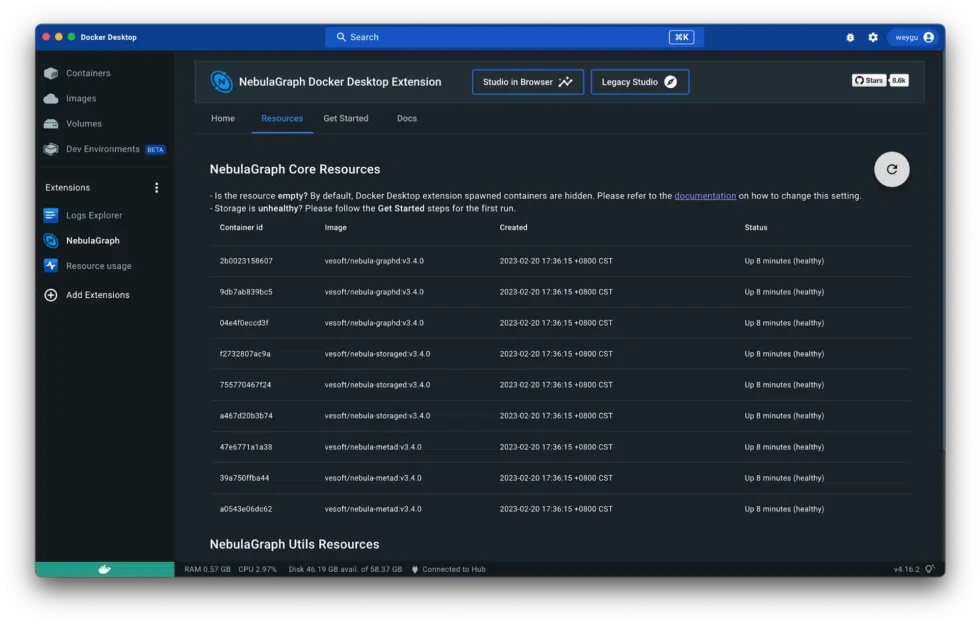
Figure 5: Checking the status of containers.
Step 4: Get started with NebulaGraph
After the cluster is healthy, we can follow the Get Started steps to log in to the NebulaGraph Studio, then load the initial dataset, and query the graph (Figure 6).
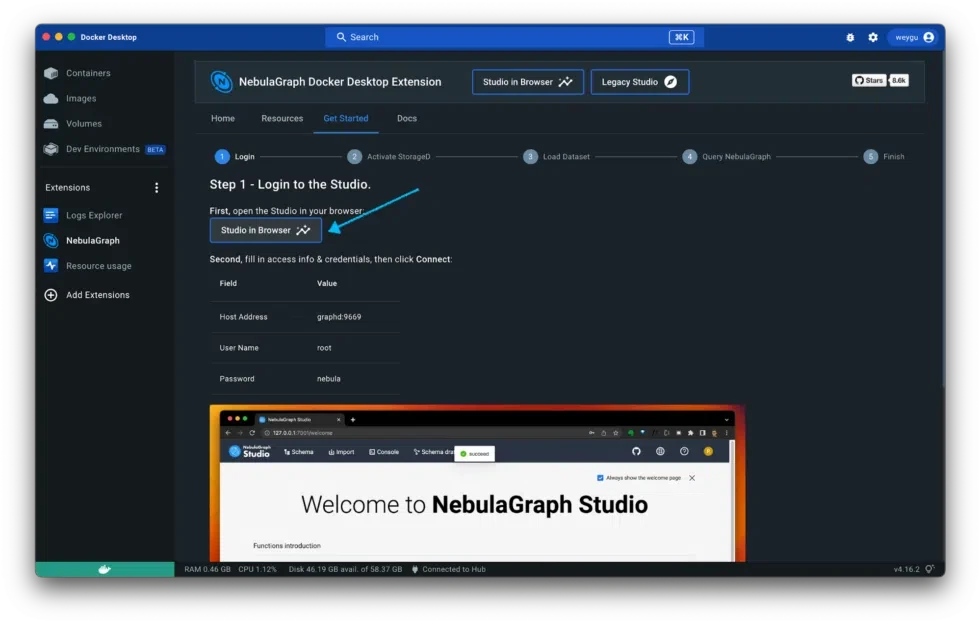
Figure 6: Logging in to NebulaGraph Studio.
Step 5: Learn more from the starter datasets
In a graph database, the focus is on the relationships between the data. With the starter datasets available in NebulaGraph Studio, you can get a better understanding of these relationships. All you need to do is click the Download button on each dataset card on the welcome page (Figure 7).
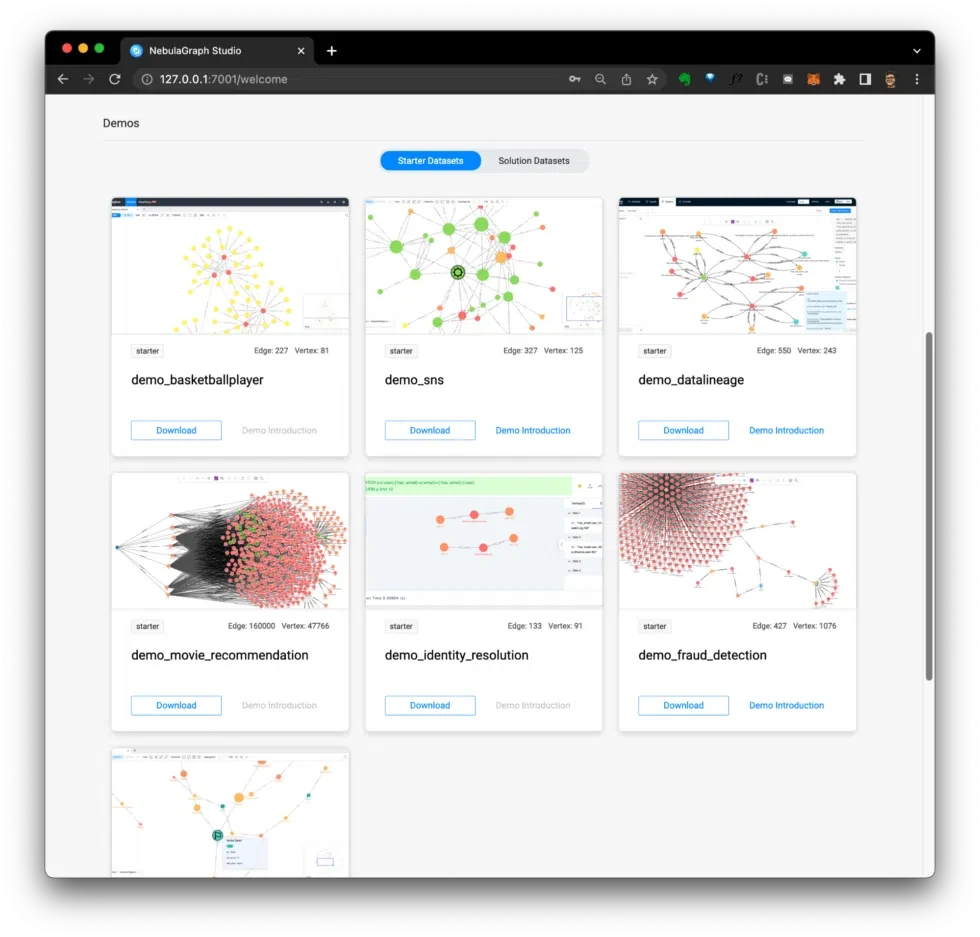
Figure 7: Starter datasets.
For example, in the demo_sns (social network) dataset, you can use the following query to find new friend recommendations by identifying second-degree friends with the most mutual friends:
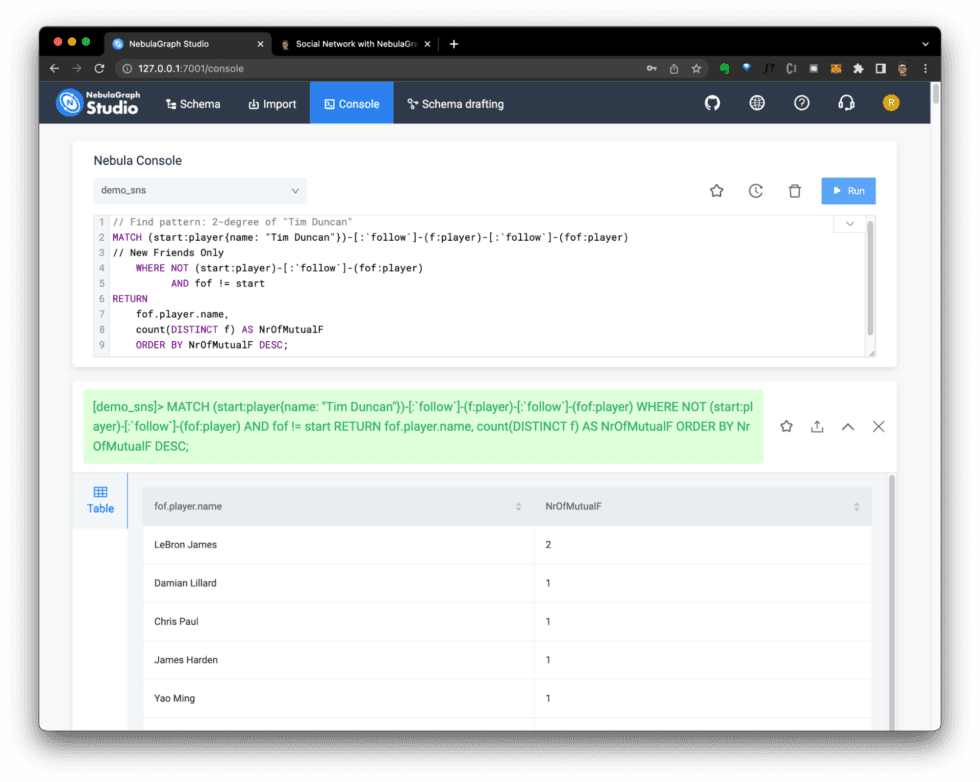
Figure 8: Query results shown in the Nebula console.
Instead of just displaying the query results, you can also return the entire pattern and easily gain insights. For example, in Figure 9, we can see LeBron James is on two mutual friend paths with Tim:
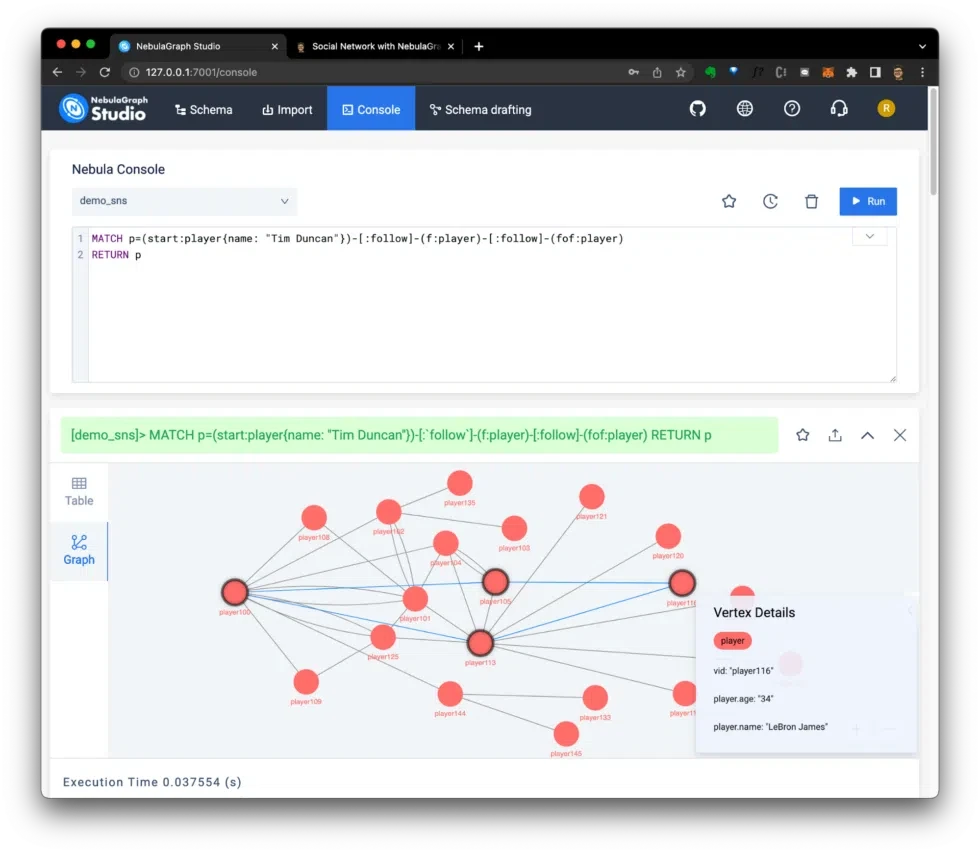
Figure 9: Graphing the query results.
Another example can be found in the demo_fraud_detection(graph of loan) dataset, where you can perform a 10-degree check for risky applicants, as shown in the following query:
The results shown in Figure 10 indicate that this applicant is suspected to be risky because of their connection to p_190.
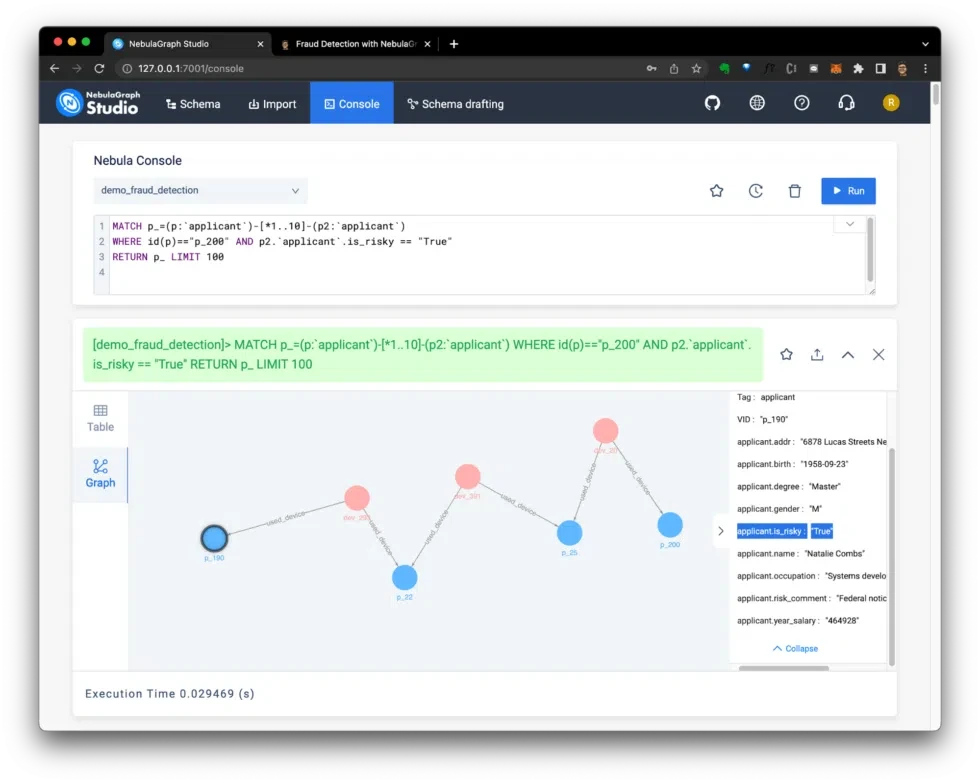
Figure 10: Results of query showing fraud detection risk.
By exploring the relationships between data points, we can gain deeper insights into our data and make more informed decisions. Whether you are interested in finding new friends, detecting fraudulent activity, or any other use case, the starter datasets provide a valuable starting point.
We encourage you to download the datasets, experiment with different queries, and see what new insights you can uncover, then share with us in the NebulaGraph community.
Try NebulaGraph for yourself
To learn more about NebulaGraph, visit our website, documentation site, star our GitHub repo, or join our community chat.
[
](javascript:window.open('https://bit.ly/3XHS873'))
