Release-notes
NebulaGraph Visualization v3.4.0 Launched to Support Incremental Backup
Along with the release of NebulaGraph v3.4.0, its graph visualization products NebulaGraph Dashboard, NebulaGraph Explorer, and NebulaGraph Studio have also been upgraded to their latest versions. In this article, we will take a quick look at the new features of each visualization product.
NebulaGraph Dashboard
NebulaGraph Dashboard is a powerful visualization and operations tool for the NebulaGraph database, designed to make the work of DBAs and operations personnel easier. With Dashboard, you can quickly create and import clusters and monitor them in real time, receiving alarms as needed. Additionally, the dashboard offers various operations such as cluster upgrades, scaling, backup and recovery, and service start and stop, making cluster management more straightforward and intuitive.
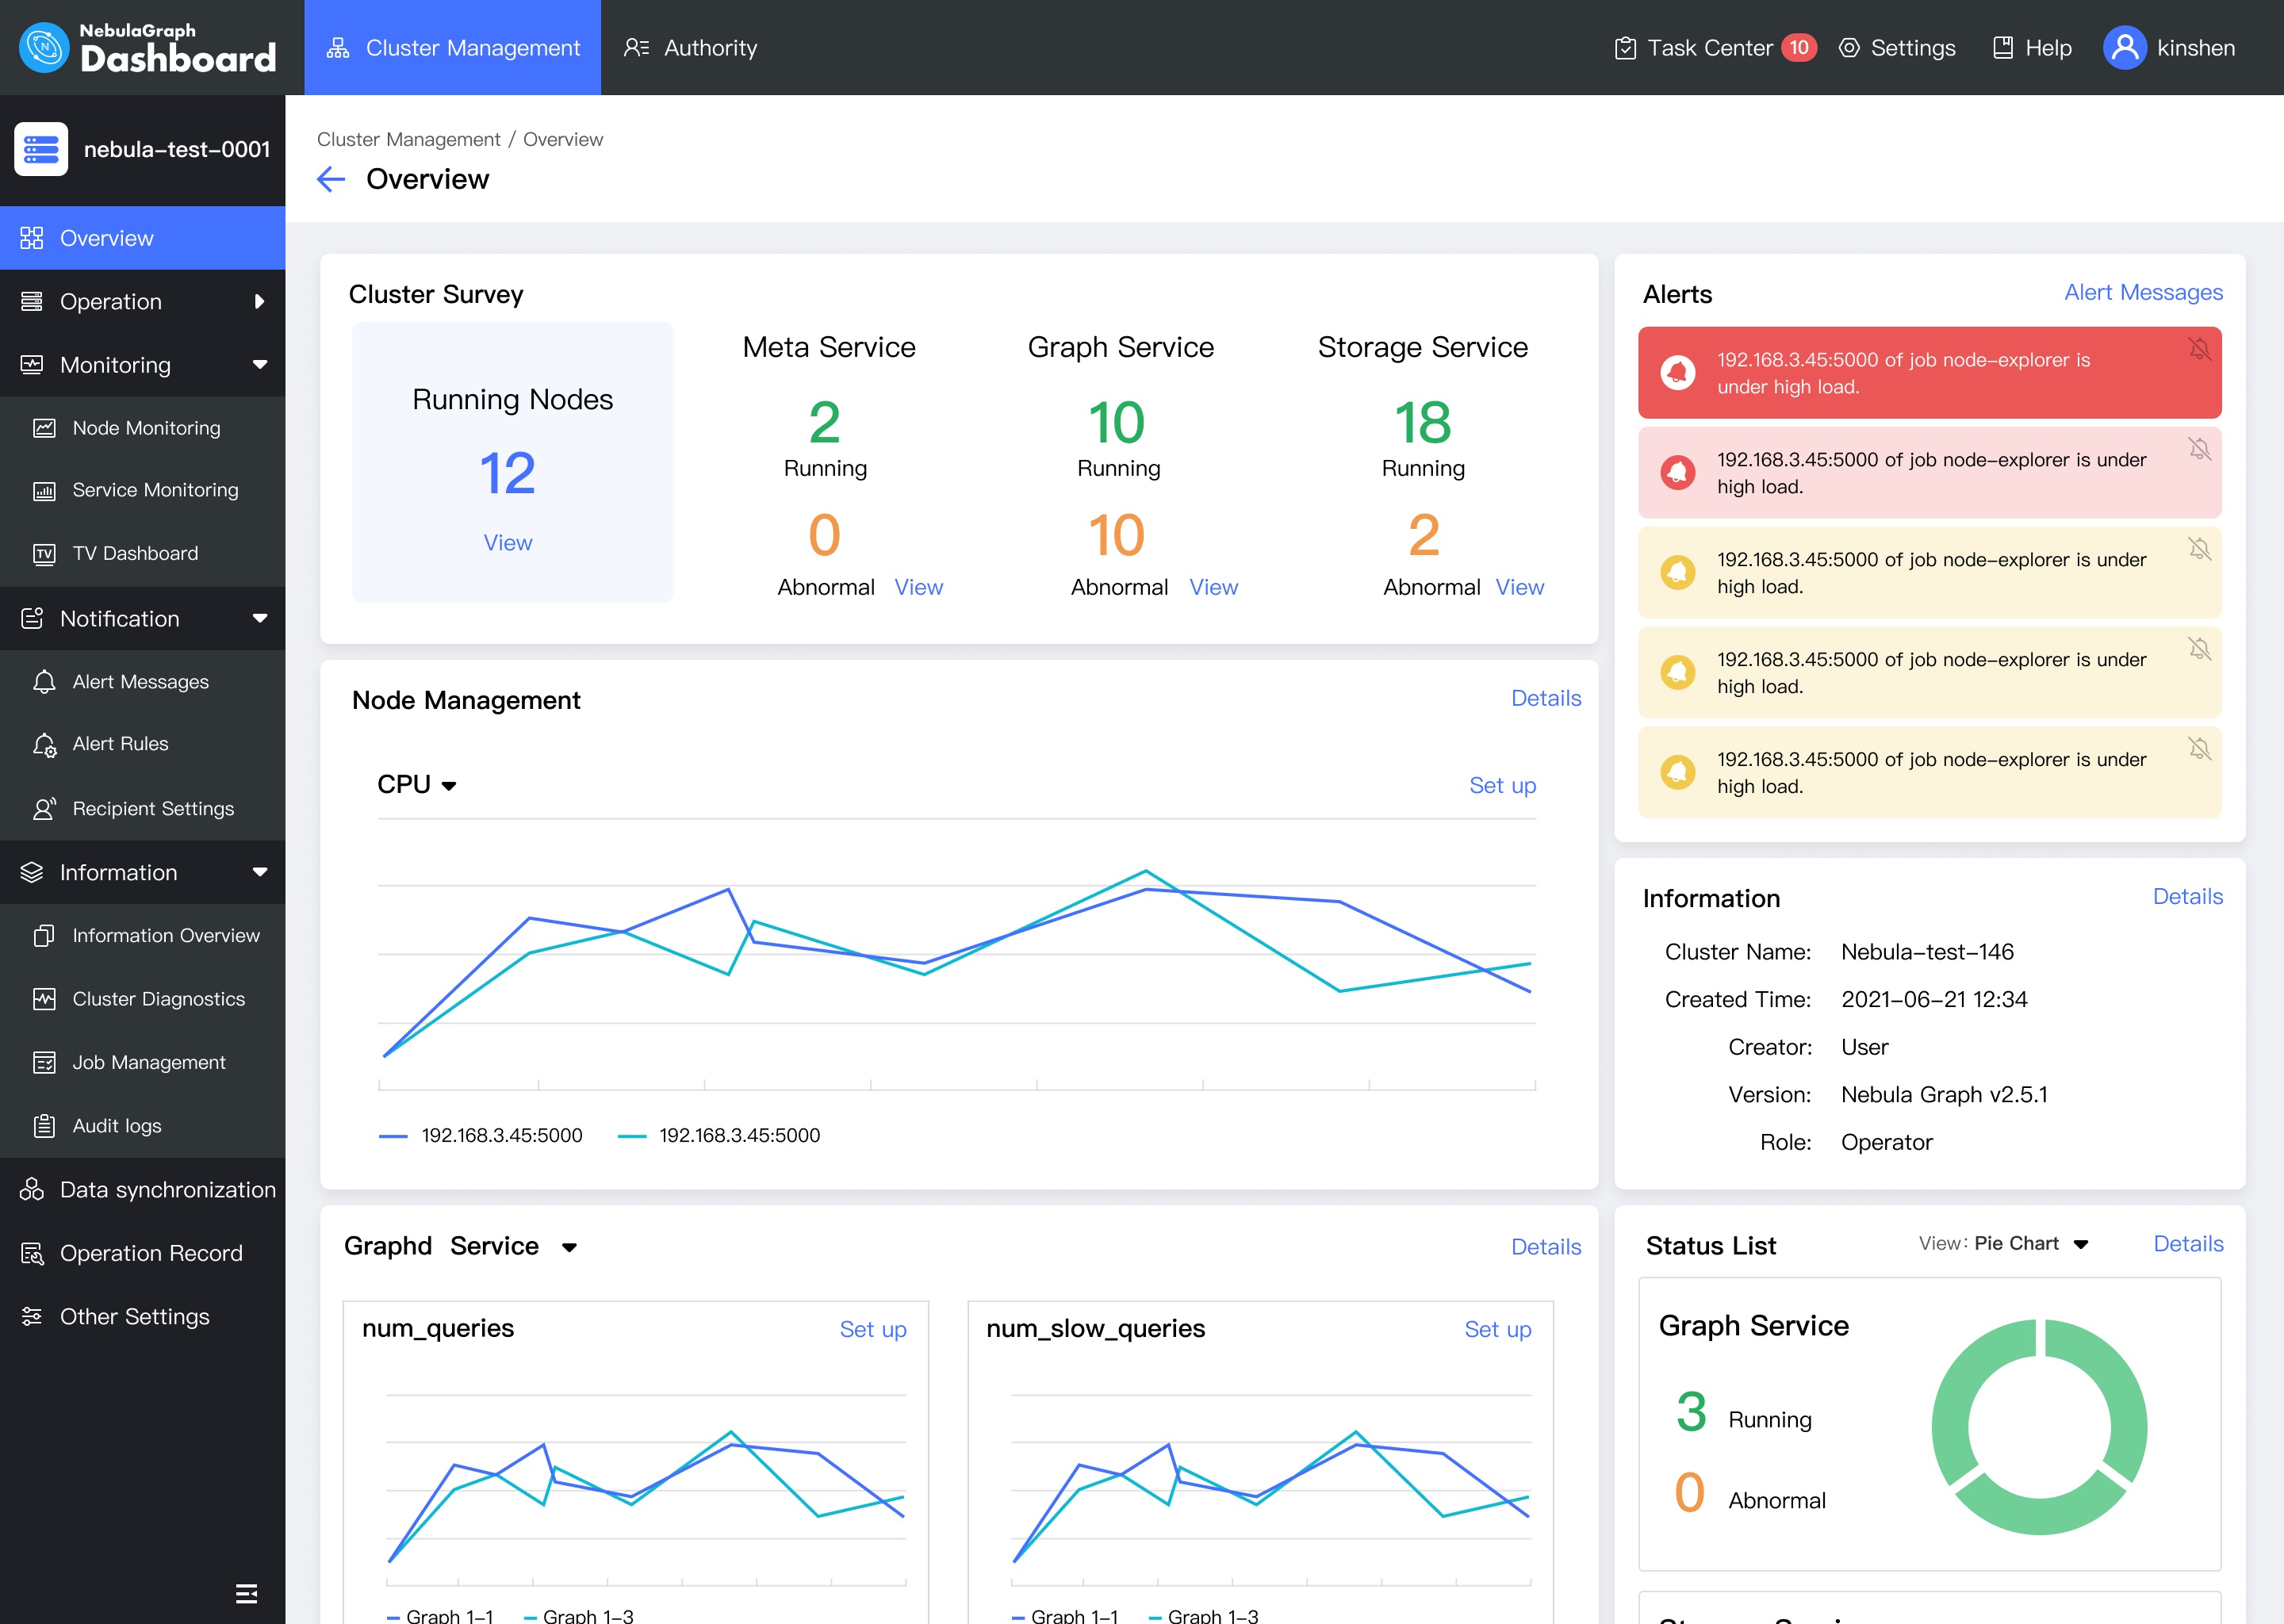
New Features of NebulaGraph Dashboard Enterprise Edition
- When system failures occur, troubleshooting problems by reviewing runtime logs is often necessary. The 3.4.0 version of NebulaGraph Dashboard allows viewing NebulaGraph runtime logs, quickly identifying the issues.

- In addition to runtime logs, NebulaGraph Dashboard's audit log feature classifies and stores all operations the Graph service receives, making it easy to review NebulaGraph audit logs.

- Furthermore, NebulaGraph Dashboard allows for visual management of long-running tasks, also known as jobs, within a specified graph space, including the ability to view, stop, resume, and view the details of individual jobs.

- Additionally, you can also incrementally back up existing backup files on S3 through the Dashboard.

Enhancements in NebulaGraph Dashboard Community Edition v3.4.0
Feature
- Support the built-in dashboard.service script to manage the Dashboard services with one-click and view the Dashboard version.
- Support viewing the configuration of Meta services.
Enhancement
- Adjust the directory structure and simplify the deployment steps.
- Display the names of the monitoring metrics on the overview page of
machine. - Optimize the calculation of monitoring metrics such as
num_queries, and adjust the display to time series aggregation.
NebulaGraph Explorer
NebulaGraph Explorer is a web-based visual graph exploration tool. Based on the NebulaGraph Database for visual interaction with graph data, it supports fast finding friends and neighbors, analyzing suspicious targets, and performing graph computational analysis from complex relationships and large amounts of data.
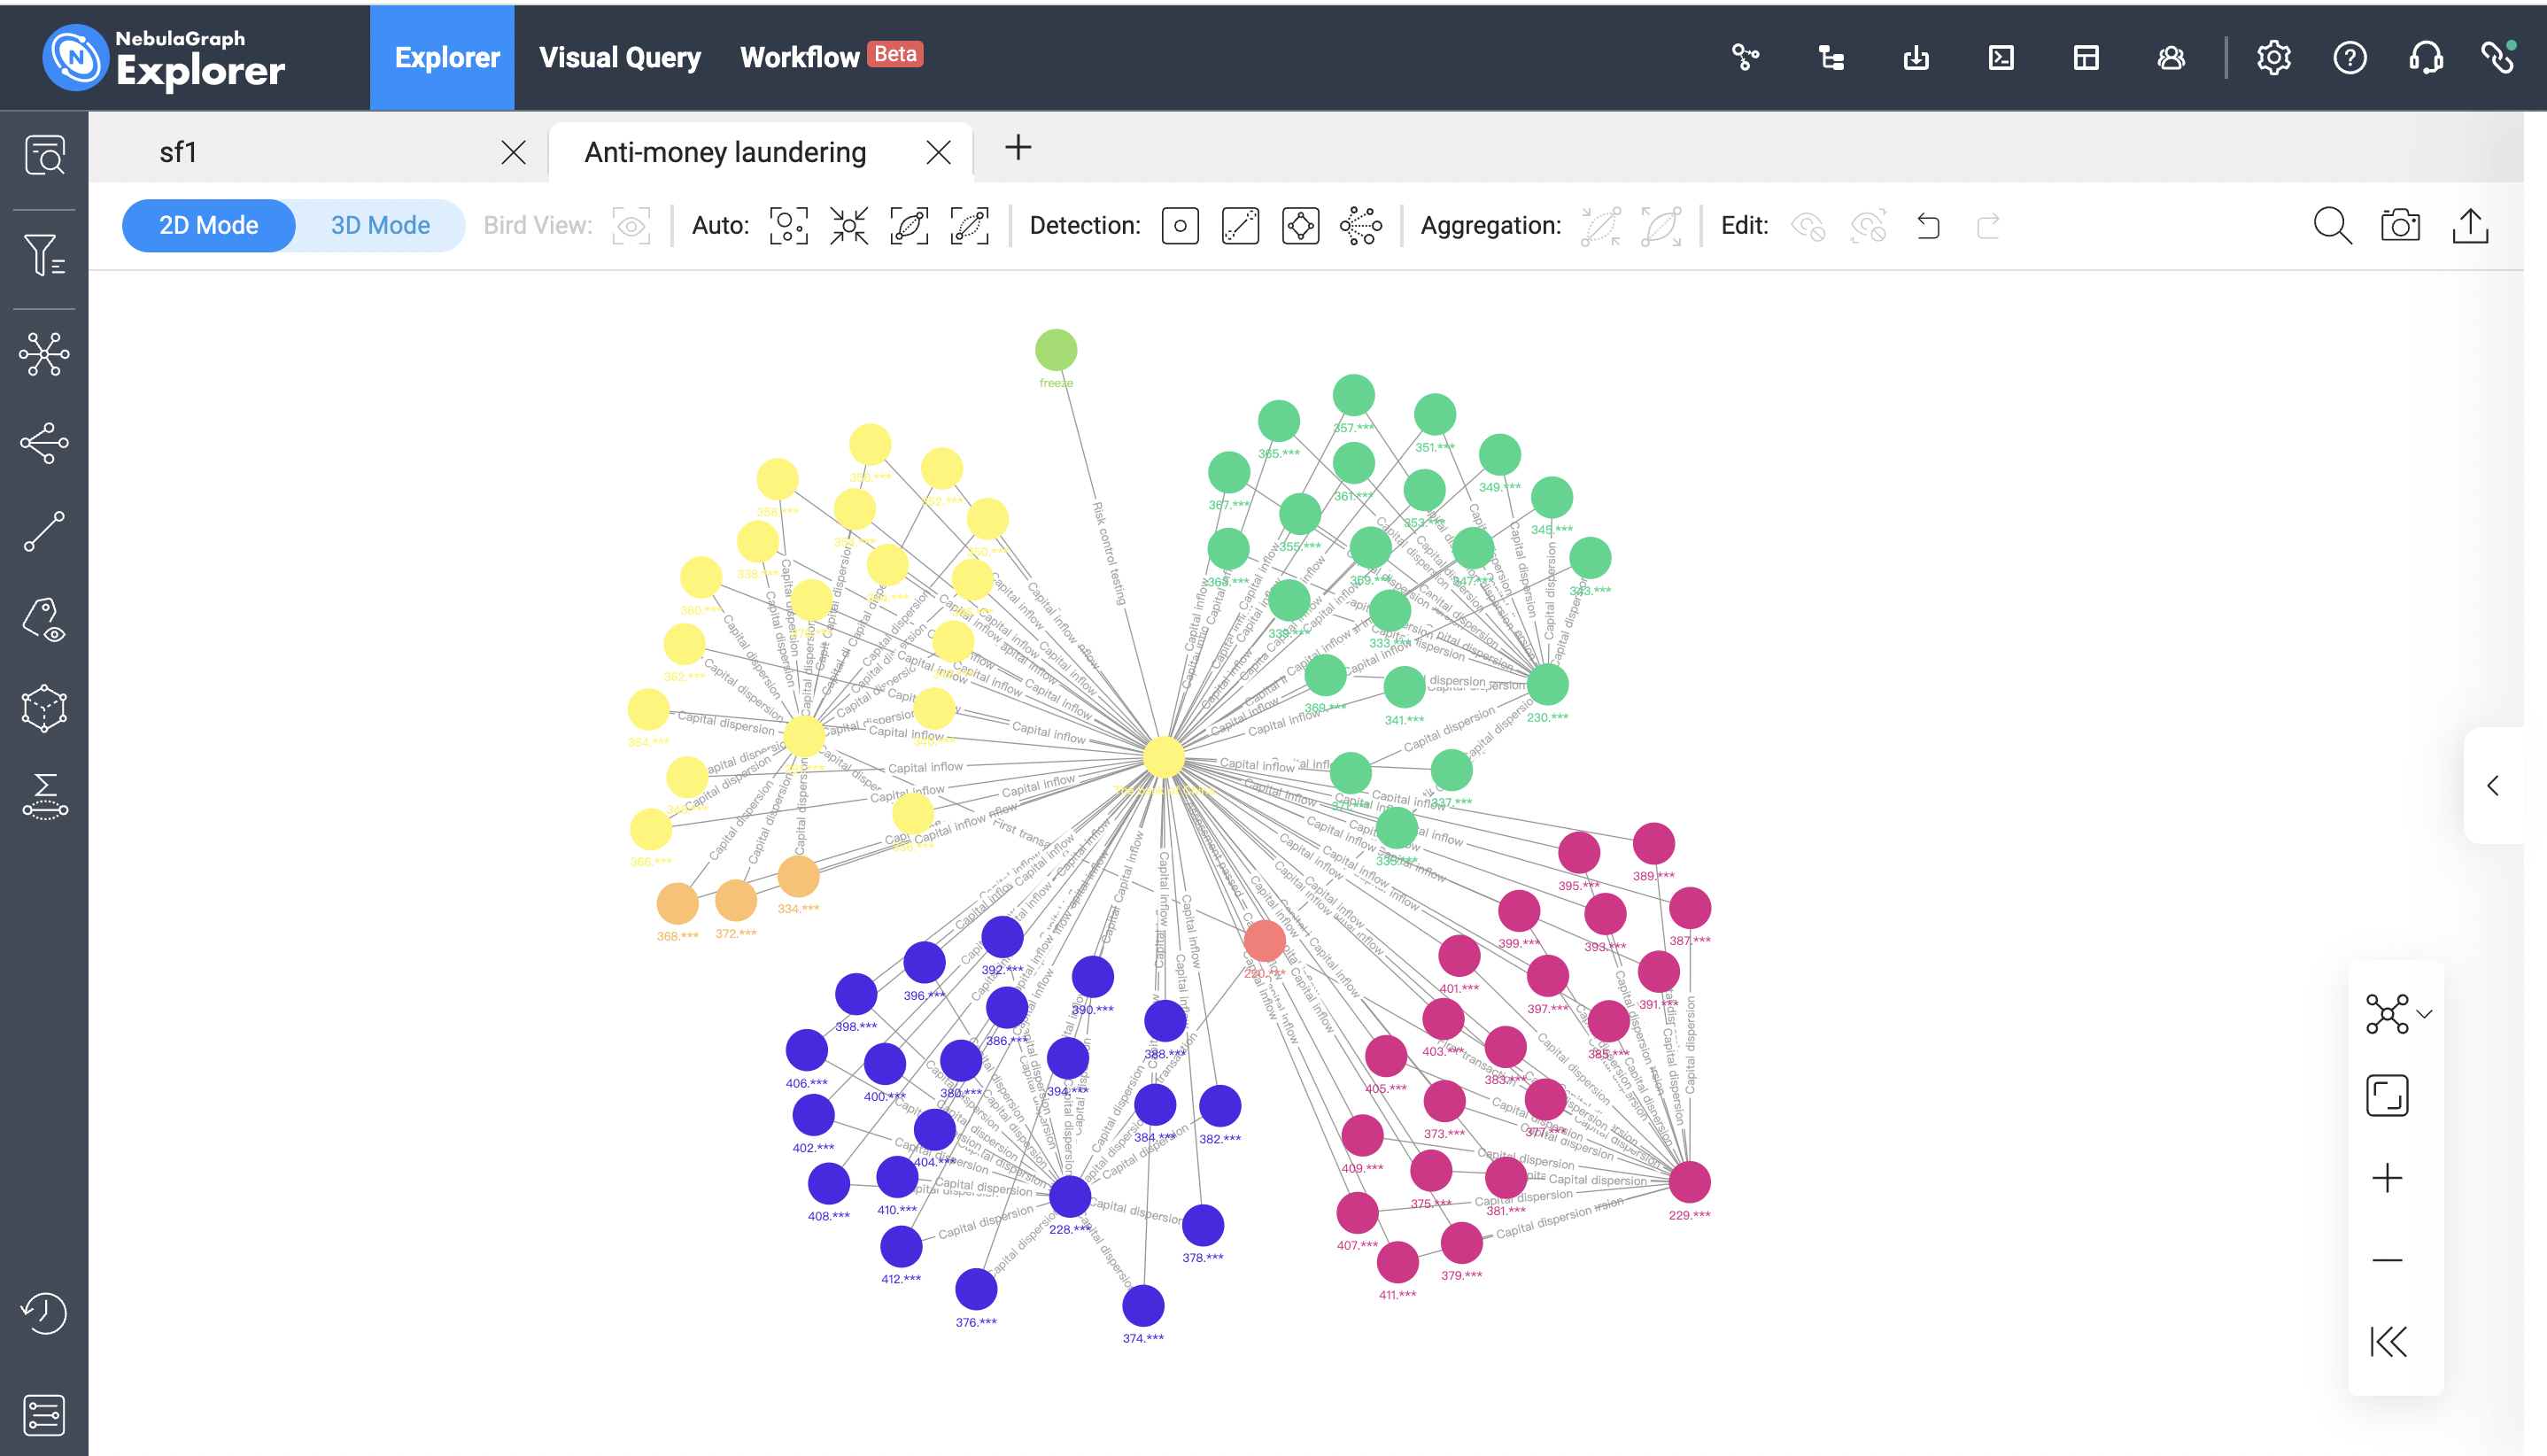
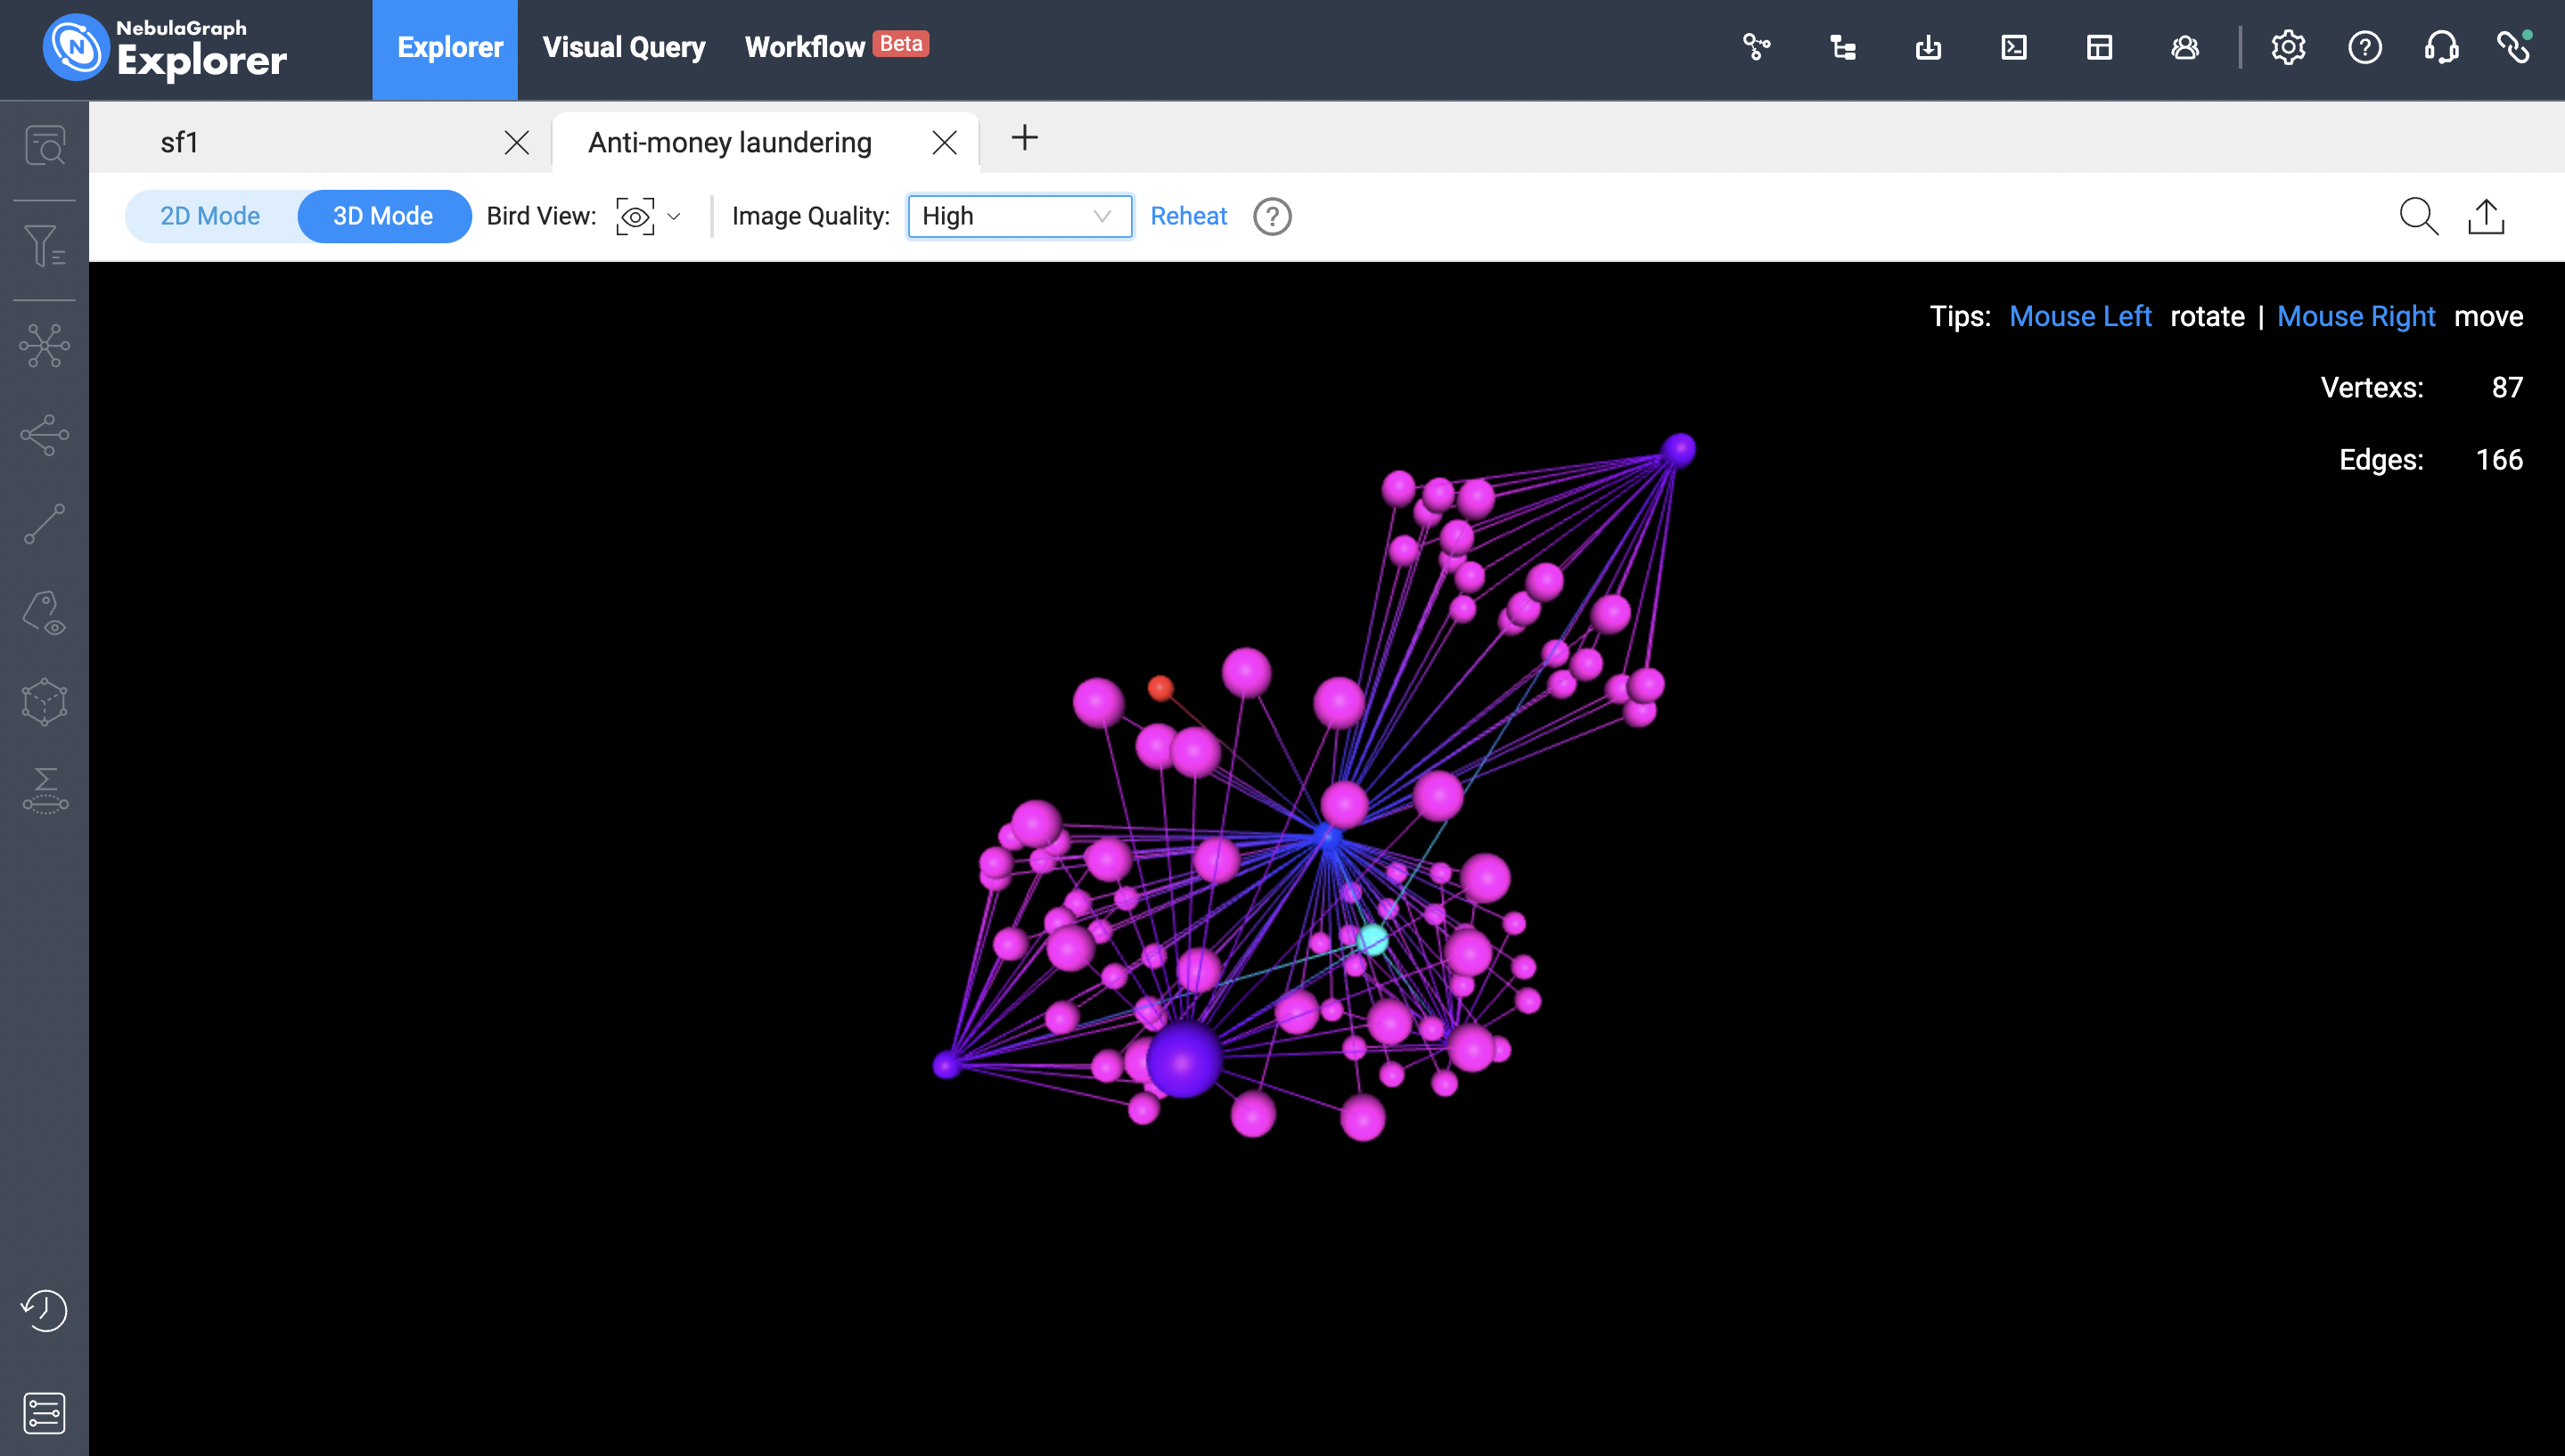
The new version of NebulaGraph Explorer supports viewing the schema creation statement for the specified graph space, and you can download the statement or copy it to the console for execution.
Removed the timeout limit for viewing slow queries.
This iteration of NebulaGraph Explorer places a major emphasis on product usability and visualization presentation, spending a significant amount of time polishing the functions of the explorer, hoping to help users more quickly and easily explore relationships between data. For more details, please see the release notes.
NebulaGraph Studio
Finally, the open-source web-based graph visualization tool NebulaGraph Studio. It now supports viewing the creation statements of Schema just like NebulaGraph Explorer. And a feedback page is integrated for easier issue collection. Besides, we have made optimization in multiple aspects and fixed some bugs, making it better than ever.
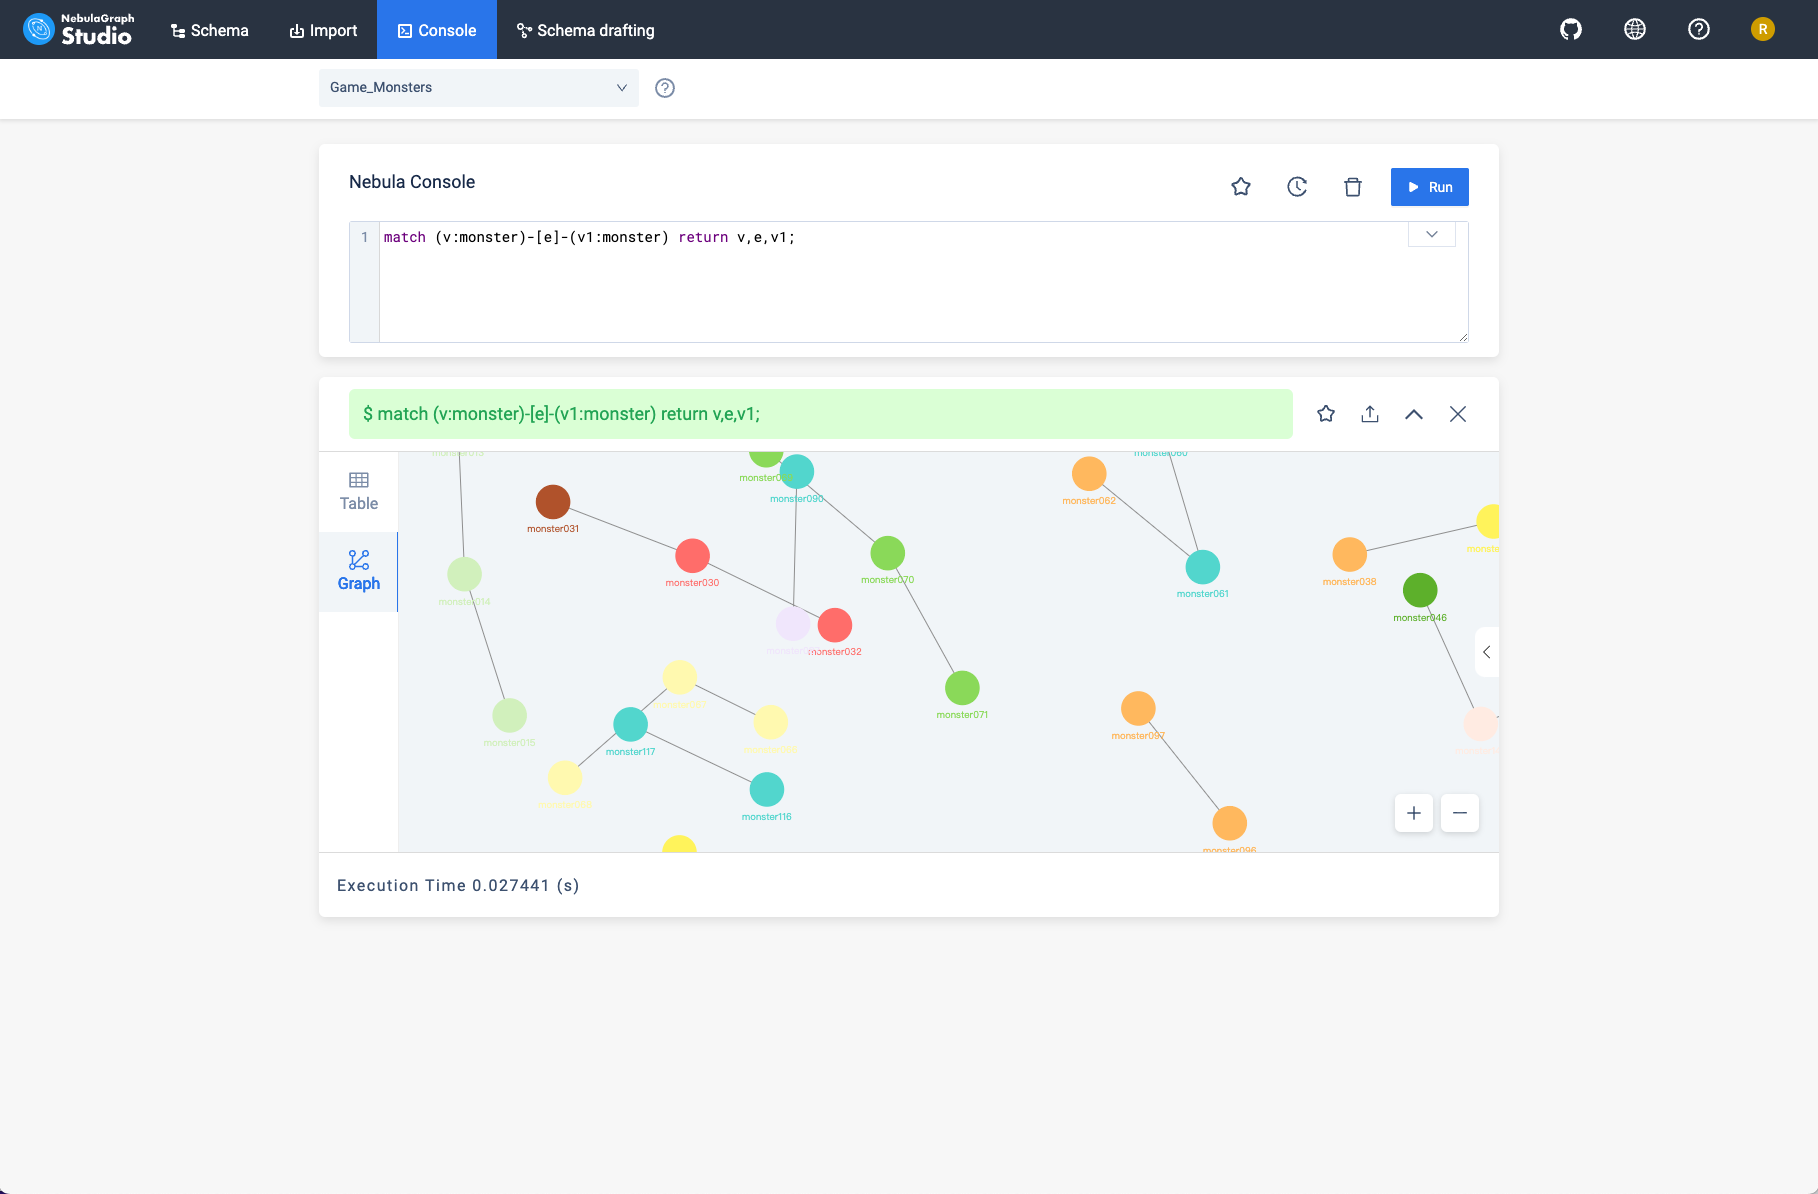
It now supports viewing the creation statements of Schema just like NebulaGraph Explorer. And a feedback page is integrated for easier issue collection. Besides, we have made optimization in multiple aspects and fixed some bugs, making it better than ever.
Get started free with the latest version of NebulaGraph Studio, click the link to download https://github.com/vesoft-inc/nebula-studio/releases/tag/v3.6.0
Are you interested in experiencing the entire NebulaGraph Database Enterprise Edition in one go? Click here to have a 30-day free trial right away!
