Use-cases
Exploring Contributor Relationships in the Open Source NebulaGraph Community: A Graph Visualization Approach
As the largest code hosting platform worldwide, GitHub has more than 372,000,000 repositories, of which 28,000,000 are public. The distributed graph database NebulaGraph is one of them. Like other open-source projects, NebulaGraph Database has its own contributors. This article attempts to explore the traces of these contributors using graph visualization, "peeping" into the relationship between contributors and projects in the Open Source NebulaGraph Community and the PR traces they leave behind.
The story began two months ago when one day when one of our developers installed a database called ClickHouse, in which he found an appealing contributor system table, so we were inspired and decided to give it a try in NebulaGraph Contributors.
The ClickHouse Contributor System Table
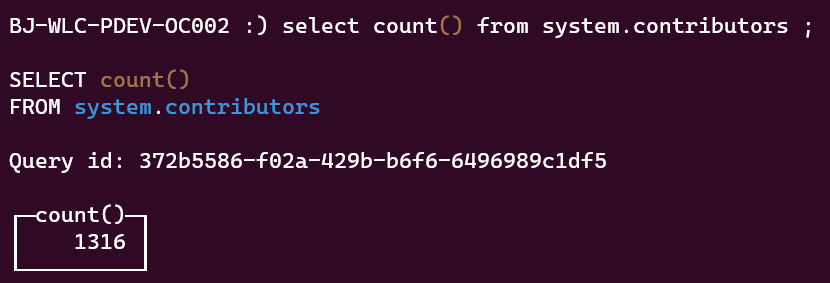
Simply put, as long as you install the ClickHouse database, you can execute the following SQL through the default data table, without connecting to any database:
select count() from system.contributors
You can then get the total number of ClickHouse contributors (the data below may be slightly outdated).
You can also randomly obtain a list of 20 contributors in the following way:
select * from system.contributors limit 20;
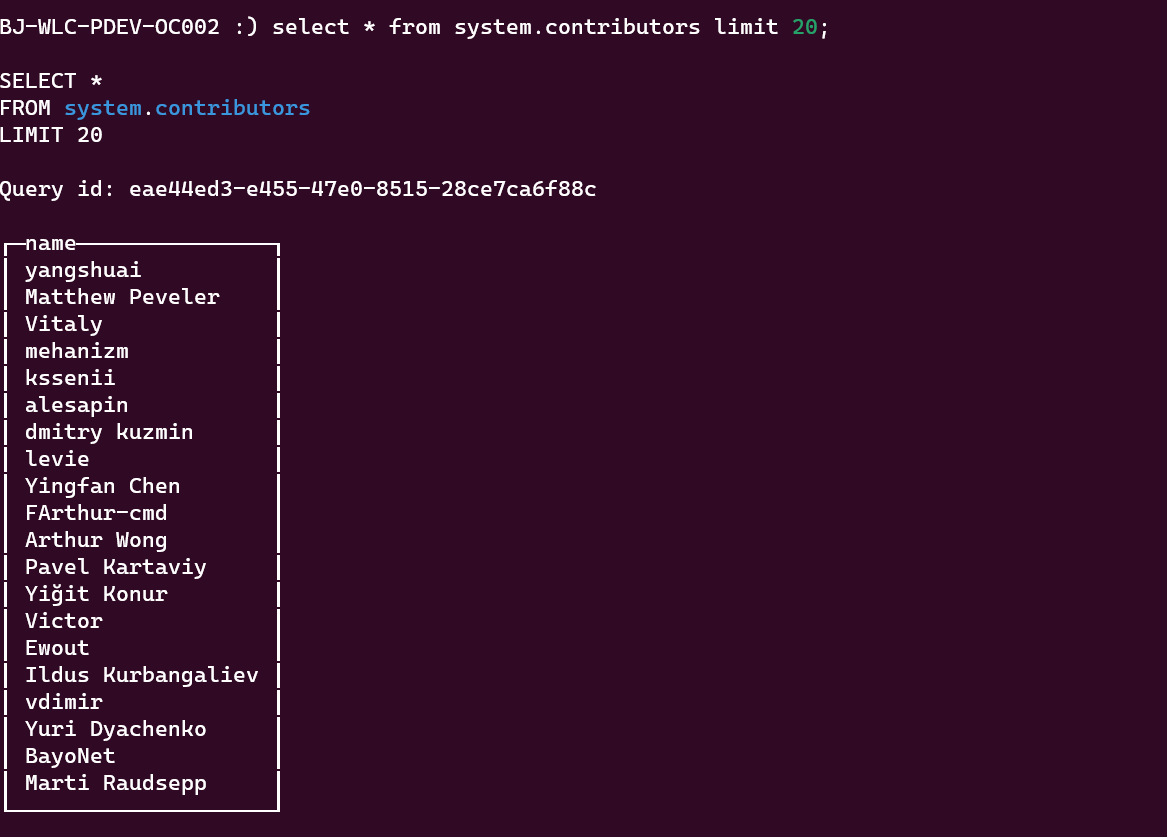
This method of using SQL to view contributors is quite cool. After all, contributors are a group of people who improve and iterate products by submitting PRs, and a large part of the contributors are engineers who are adept at SQL.
ClickHouse's SQL method for viewing contributors is indeed cool, but ultimately, we want to look at the relationship between contributors and open-source projects. When it comes to "relationships," graph databases are the way to go. Although the dataset in this article is too simple and not a large-scale dataset, using a graph database might be overkill, it's worth a try. Let's see, me, a person who can't write SQL can use NebulaGraph visualization tools to view the relationship between contributors and projects.
Visible Contributor and Pull Requests Relationships
In this section, we'll look at the statistics of contributors and Pull Requests in the NebulaGraph Open Source Community. The hands-on part of how this data is generated and displayed will follow.
Overview of the NebulaGraph Open Source Community
Here, we've included the contributions of all public repositories related to NebulaGraph, which roughly looks like this:
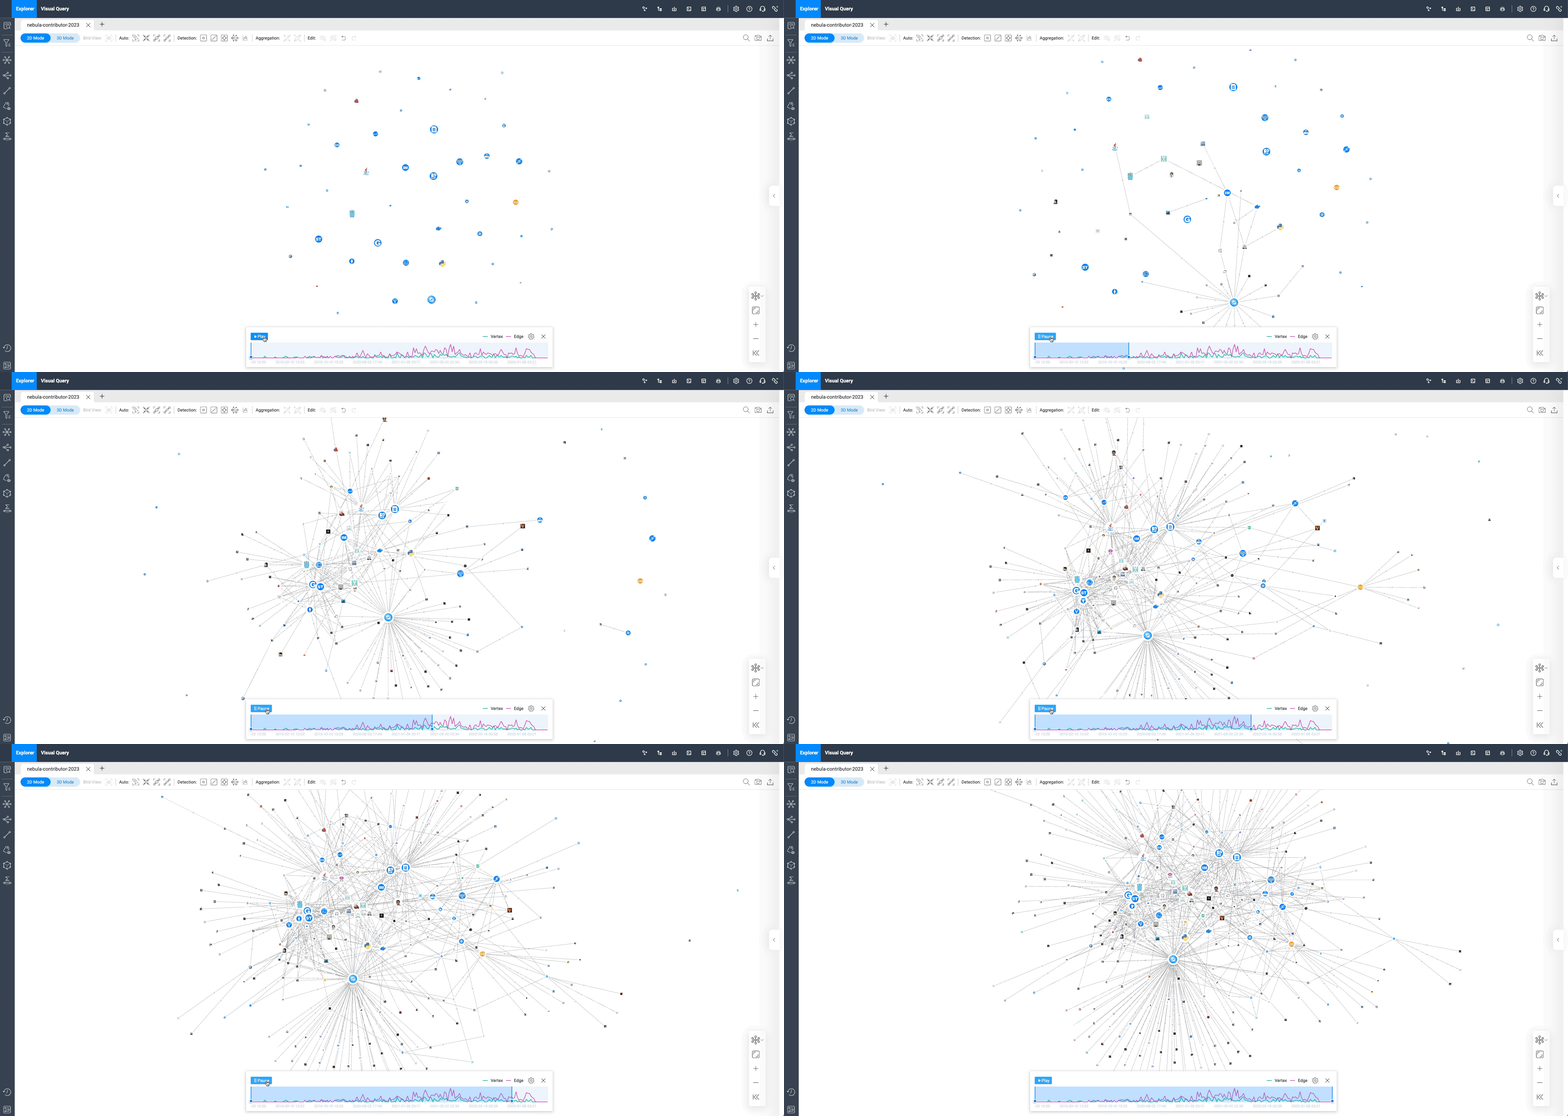
After adding a time sequence, individual contributors (square graphs) appear on the canvas, connected to each repo (circular graphs). This only shows the first PR submitted by all contributors, with more queries in the "Visual Graph Exploration" section to follow.
The following sections are hands-on content. Let's take a look at how to generate a visual relationship graph of contributors and open-source projects.
Hands-on Visual Graph Data Exploration
We'll focus on introducing the visualization tool used in this article — NebulaGraph Explorer. For a detailed introduction, refer to the documentation: https://docs.nebula-graph.io/3.4.1/nebula-explorer/about-explorer/ex-ug-what-is-explorer/.
NebulaGraph Explorer has two main features: easy to use and what-you-see-is-what-you-get. I can use the online Explorer environment without having to set up my own database. Of course, if you want a free online environment like mine, you'll need NebulaGraph Cloud Service, which comes with the visual graph exploration tool NebulaGraph Explorer.
Now that we have a tool for data exploration, the first question is where the data comes from.
Simple Data Modeling
Before collecting data, we need to do some simple modeling (I've never seen such a simple graph model) to understand the data we need to collect. The following is the graph model:
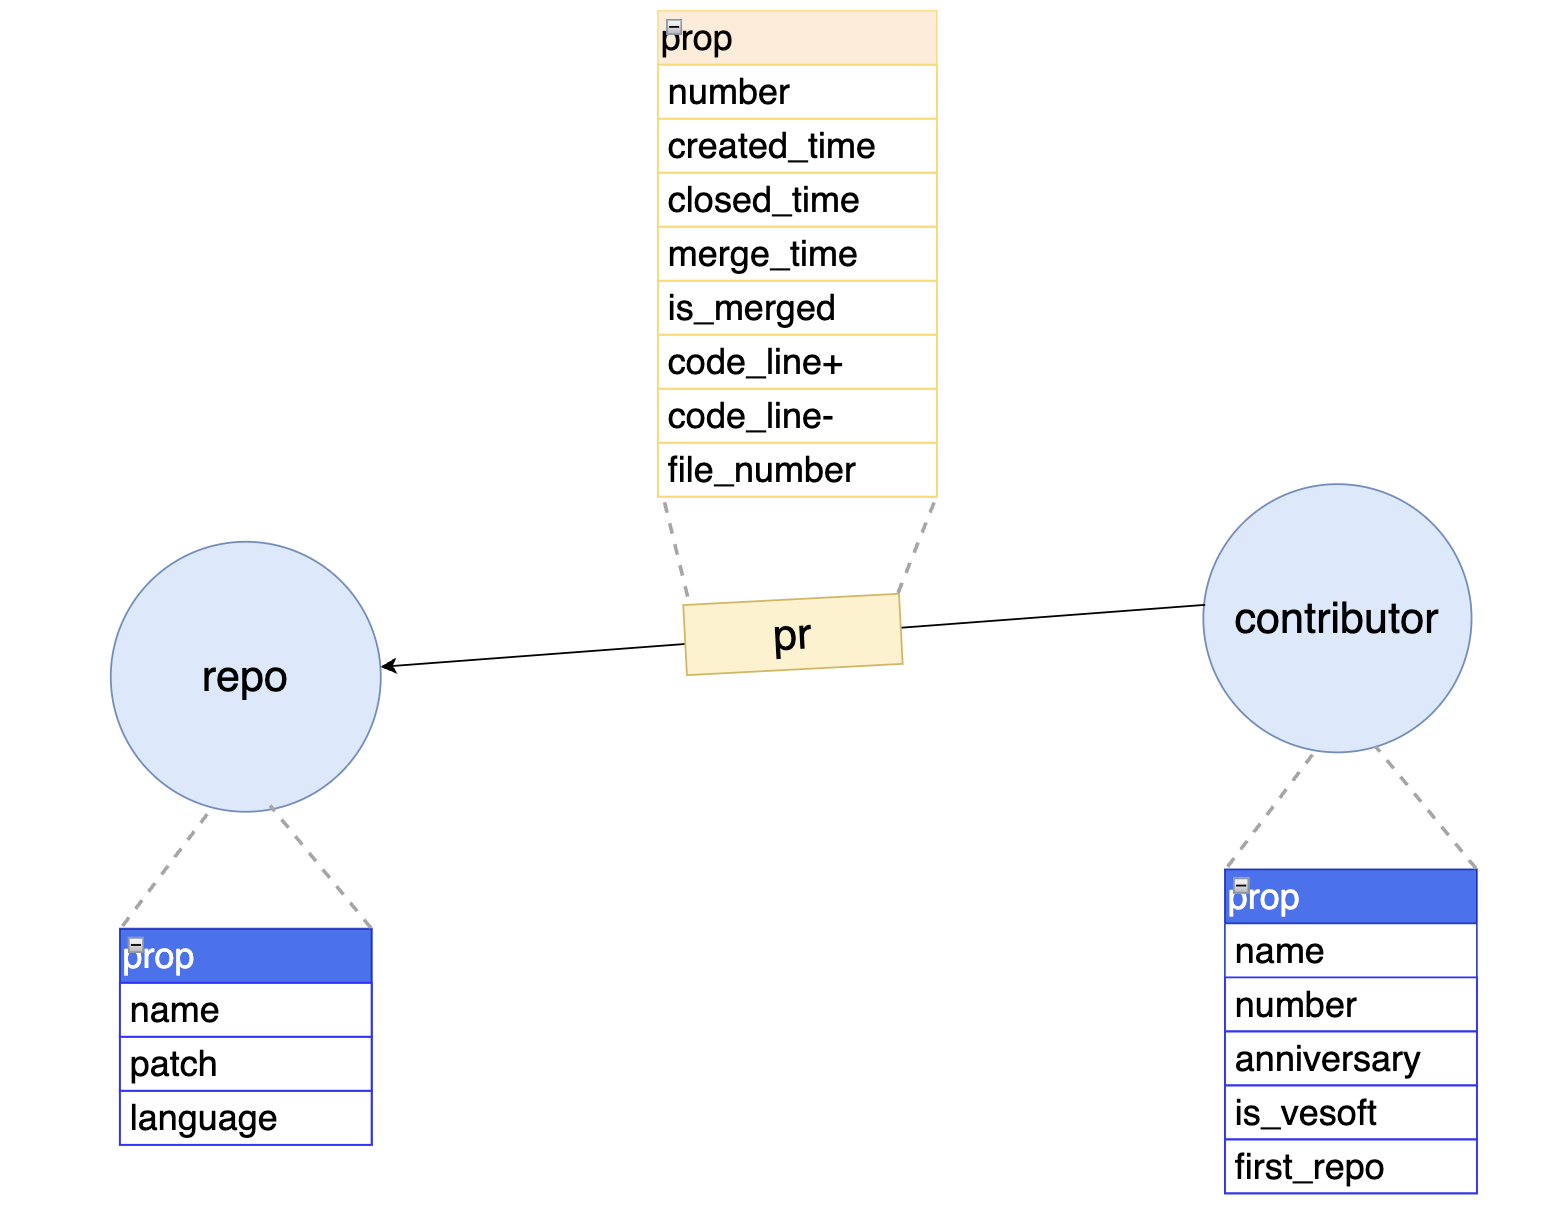
This graph model has two types of vertices: repo and contributor, connected by the edge type- pr, forming the most basic vertex-edge graph model. In the distributed graph database NebulaGraph, vertex types are represented by tag, and edge types are represented by edgetype. A vertex can have several tags; the vertex ID is the vid, which uniquely identifies it, like an ID card.
tag
repo, with three properties: repository name (
name), primary programming language (language), and repository path (path);contributor, with five properties: contributor name (
name), contributor number (number), anniversary (anniversary), whether a NebulaGraph developer employee (is_vesoft), and the first merged PR's repository (first_repo). The property "whether a NebulaGraph developer employee" is added to avoid super-large nodes, as the PR output of a company employee is different from that of other non-employee contributors. (This will be reflected in the later visualization display)
edgetype
- pr, with property: PR
number, submission time (created_time), closing time (closed_time), merging time (merged_time), whether merged (is_merged), and change details:ins_code_line,des_code_line,file_number. The time fields above can be used to filter PR edges within a certain time range.
- pr, with property: PR
Contributor Data Collection
You can refer to the following code our IT engineer wrote to get started. I've used comments to indicate the places where you need to configure or fill in your own information:
# Copyright @Shinji-IkariG
from github import Github
from datetime import datetime
import sh
from sh import curl
import csv
import requests
import time

def main():
# Your GitHub ID
    GH_USER = 'xxx'
# Your personal token
    GH_PAT = 'xxx'
    github = Github(GH_PAT)
# Open Source Organization to crawl
    org = github.get_organization('vesoft-inc')
    repos = org.get_repos(type='all', sort='full_name', direction='asc')
# Name the file of pull requests data
    with open('all-prs.csv', 'w', newline='') as csvfile:
# Data to crawl
        fieldnames = ['pr num','repo','author', 'create date','close date','merged date','version','labels1','state','branch','assignee','reviewed(commented)','reviewd(approved)','request reviewer','code line(+)','code line(-)','files number']
        writer = csv.DictWriter(csvfile, fieldnames=fieldnames)
        writer.writeheader()


        for repo in repos:
            print(repo)
            Apulls = repo.get_pulls(state='all', sort='created')
            prs = []
            for a in Apulls:
                prs.append(a)

            for i in prs:
                github = Github(GH_PAT)
                print('rate_limite' , github.rate_limiting[0])
                if github.rate_limiting[0] < 500:
                    if github.rate_limiting_resettime - time.time() > 0:
                        time.sleep(github.rate_limiting_resettime - time.time()+900)
                    else:time.sleep(3700)
                else:
                    print(i.number)
                    prUrl = 'https://api.github.com/repos/'+ str(repo.full_name) + '/pulls/' + str(i.number)
                    pr = requests.get(prUrl, auth=(GH_USER, GH_PAT))


                    assigneesList = []
                    if pr.json().get('assignees'):
                        for assignee in pr.json().get('assignees'):
                            assigneesList.append(assignee.get('login'))
                    else: ""


                    reviewerCList = []
                    reviewerAList = []
                    reviewers = requests.get(prUrl + '/reviews', auth=(GH_USER, GH_PAT))
                    if reviewers.json():
                        for reviewer in reviewers.json():
                            if reviewer.get('state') == 'COMMENTED':
                                if reviewer.get('user'):
                                    reviewerCList.append(reviewer.get('user').get('login'))
                                else: reviewerCList.append('GHOST USER')
                            elif reviewer.get('state') == 'APPROVED':
                                if reviewer.get('user'):
                                    reviewerAList.append(reviewer.get('user').get('login'))
                                else: reviewerAList.append('GHOST USER')
                            else : print(reviewer.get('state'), 'TYPE REVIEWS')
                    else: ""


                    reqReviewersList = []
                    reqReviewers = requests.get(prUrl + '/requested_reviewers', auth=(GH_USER, GH_PAT))
                    if reqReviewers.json().get('users'):
                        for reqReviewer in reqReviewers.json().get('users'):
                            reqReviewersList.append(reqReviewer.get('login'))
                        print(reqReviewersList)
                    else: ""


                    labelList = []
                    if pr.json().get('labels'):
                        for label in pr.json().get('labels'):
                            labelList.append(label.get('name'))
                    else: ""


                    milestone = pr.json().get('milestone').get('title') if pr.json().get('milestone') else ""


                    writer.writerow({'pr num': i.number,'repo': repo.full_name,'author': pr.json().get('user').get('login'), 'create date': pr.json().get('created_at'),'close date': pr.json().get('closed_at'),'merged date': pr.json().get('merged_at'),'version': milestone,'labels1': ",".join(labelList),'state': pr.json().get('state'),'branch': pr.json().get('base').get('ref'),'assignee': ",".join(assigneesList),'reviewed(commented)': ",".join(reviewerCList),'reviewd(approved)': ",".join(reviewerAList),'request reviewer': ",".join(reqReviewersList),'code line(+)': pr.json().get('additions'),'code line(-)': pr.json().get('deletions'),'files number': pr.json().get('changed_files')})

if __name__ == "__main__":
    main()

#pip3 install sh pygithub
Once you've run the code above, you'll get a file called all-prs.csv. The script crawls all repositories under the vesoft-inc organization without distinguishing repository status, meaning it will crawl private repository data. Therefore, we need to process the data a second time. From the processed PR data, we can extract the relevant contributor data.
As mentioned earlier, each vertex has a vid. So we set the contributor's vid to their GitHub ID, and the repo's vid to use abbreviations. The edge data's source and target are the contributor vid and repo vid mentioned above.
Now we have three files: contributor.csv, pr.csv, and repo.csv, with a similar format:
# contributor.csv
wenhaocs,haowen,148,2021-09-24 16:53:33,1,nebula
lopn,lopn,149,2021-09-26 06:02:11,0,nebula-docs-cn
liwenhui-soul,liwenhui-soul,150,2021-09-26 13:38:20,1,nebula
Reid00,Reid00,151,2021-10-08 06:20:24,0,nebula-http-gateway
...

# pr.csv
nevermore3,nebula,4095,2022-03-29 11:23:15,2022-04-13 03:29:44,2022-04-13 03:29:44,1,2310,3979,31
cooper-lzy,docs_cn,1614,2022-03-30 03:21:35,2022-04-07 07:28:31,2022-04-07 07:28:31,1,107,2,4
wuxiaobai24,nebula,4098,2022-03-30 05:51:14,2022-04-11 10:54:04,2022-04-11 10:54:03,1,53,0,3
NicolaCage,website,876,2022-03-30 06:08:02,2022-03-30 06:09:21,2022-03-30 06:09:21,1,4,2,1
...

# repo.csv
clients,nebula-clients,vesoft-inc/nebula-clients,Java
common,nebula-common,vesoft-inc/nebula-common,C++
community,nebula-community,vesoft-inc/nebula-community,Markdown
console,nebula-console,vesoft-inc/nebula-console,Go
...
Data Import
Before importing the data, we need to create the relevant Schema for data mapping.
Create Schema
Now we need to turn the graph structure model into a Schema that NebulaGraph can recognize. There are two ways to create a Schema: one is to write the Schema using the query language nGQL, and the other is to use the visual interface provided by the visual graph exploration tool NebulaGraph Explorer. For those who are not familiar with query languages like me, I recommend choosing the latter.
After logging into NebulaGraph Explorer, first, create a graph space (similar to a table in MySQL):
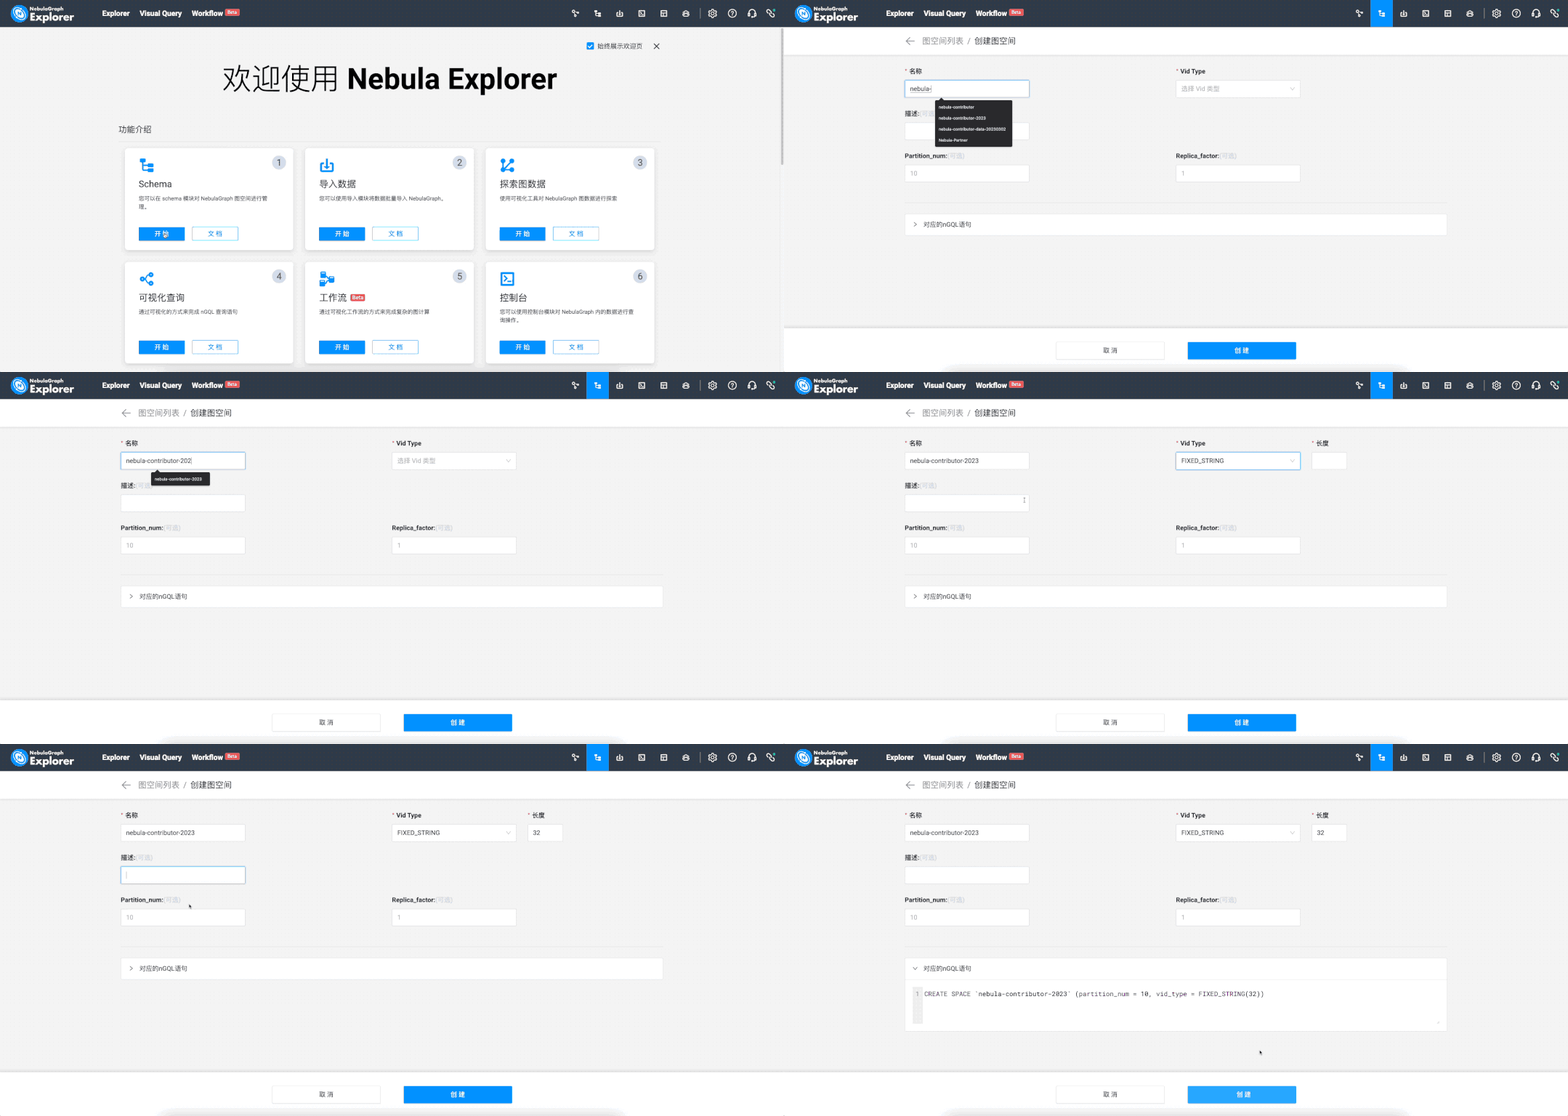
The effect is the same as the following nGQL language:
# nebula-contributor-2023 is the name of the work space;

CREATE SPACE 'nebula-contributor-2023'(partition_num = 10, vid_type = FIXED_STRING(32))
After creating the graph space, create two vertex types and one edge type, both of which have similar creation methods.
Next, let's take the more complex vertex type of contributors as an example:
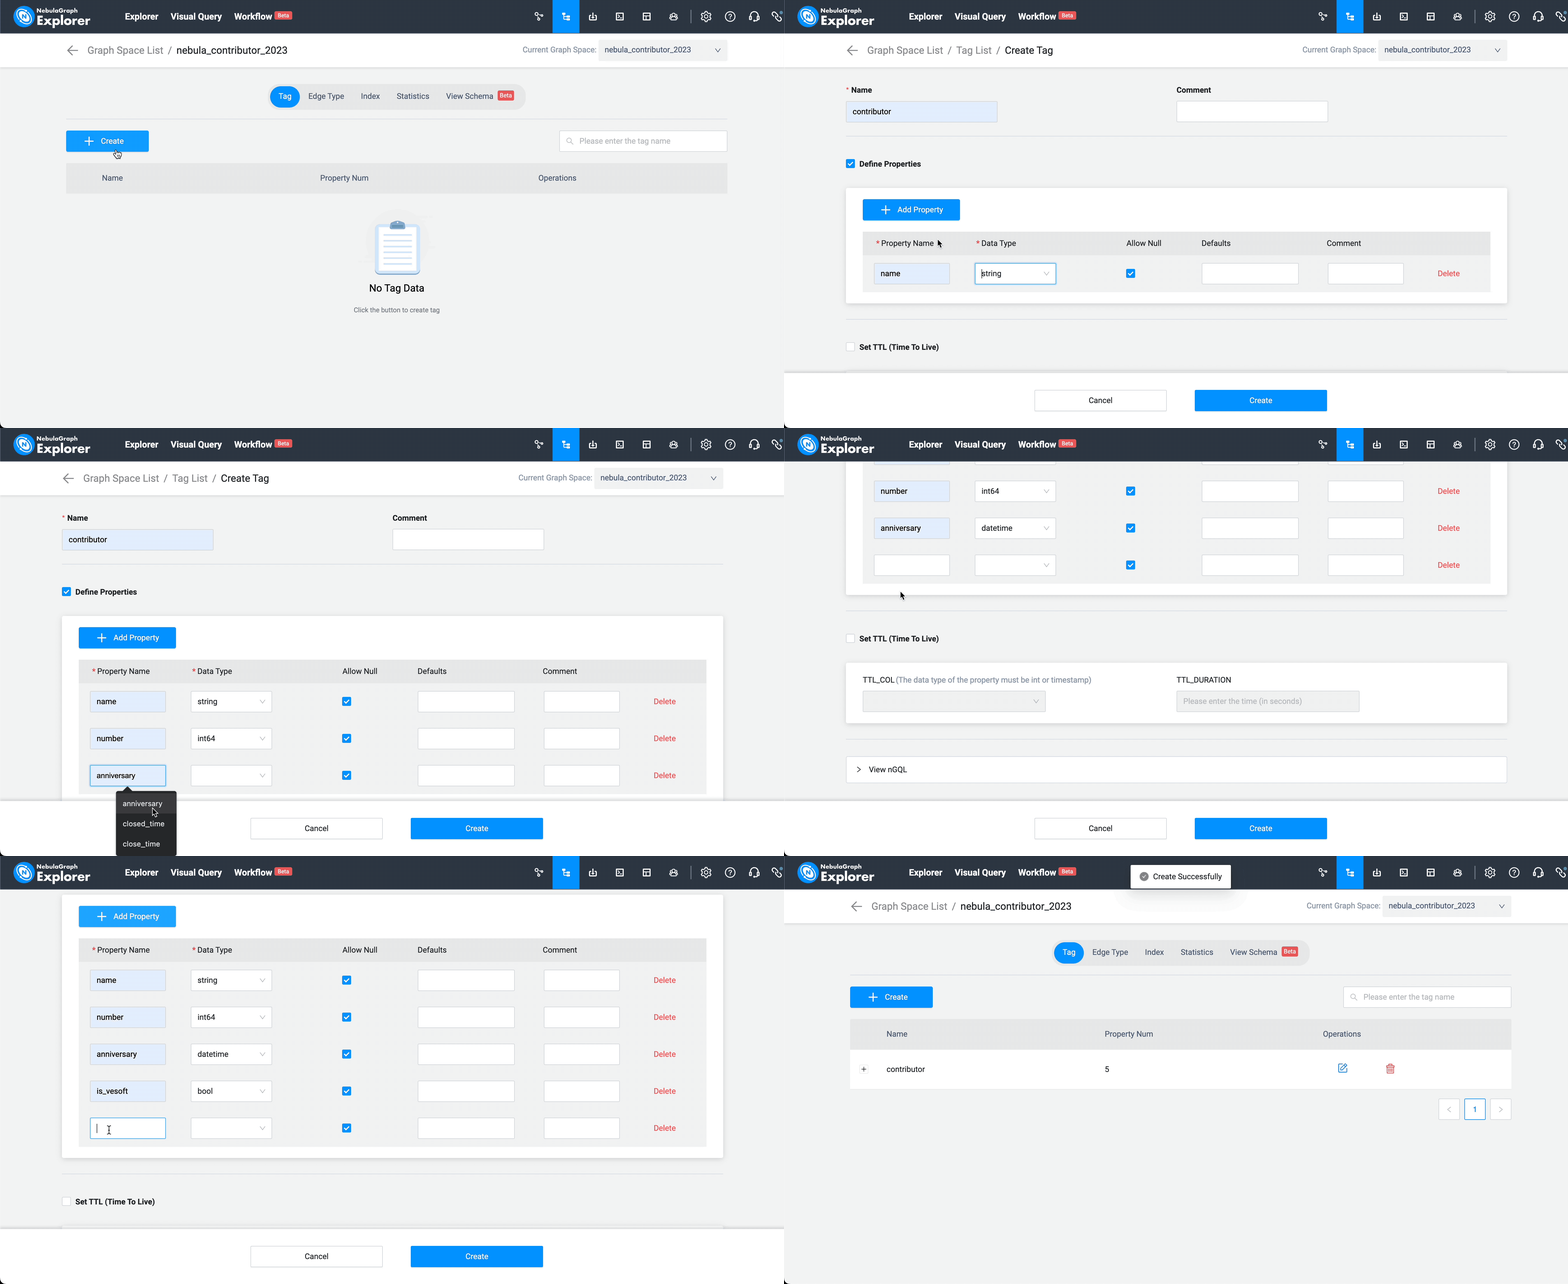
It is equivalent to this nGQL statement:
CREATE tag contributor (name string NULL, number int16 NULL, anniversary datetime NULL, is_vesoft bool NULL, first_merged string NULL) COMMENT = "contributor"
Similarly, the repo vertex and the pr edge can be created using the nGQL below or using Explorer as well.
# create repo tag
CREATE tag repo (repo_name string NULL, language string NULL, path string NULL) COMMENT = "repo"

# create pr edge
CREATE edge pr (number int NULL, created_time datetime NULL, closed_time datetime NULL DEFAULT NULL, merged_time datetime NULL DEFAULT NULL, is_merged bool NULL, ins_code_line int NULL, des_code_line int NULL, file_changed_num int NULL)
Import Data
Since we are using the visualization tool NebulaGraph Explorer, we can also use a "visible method" to upload the data. After creating the Schema, click on the "Import" option in the top-right menu bar to start the data import process.
Choose a local data source, find the paths of the three prepared CSV files, and upload the files. Start the "import" process, which mainly involves associating local data files with the Schema, similar to the image below:
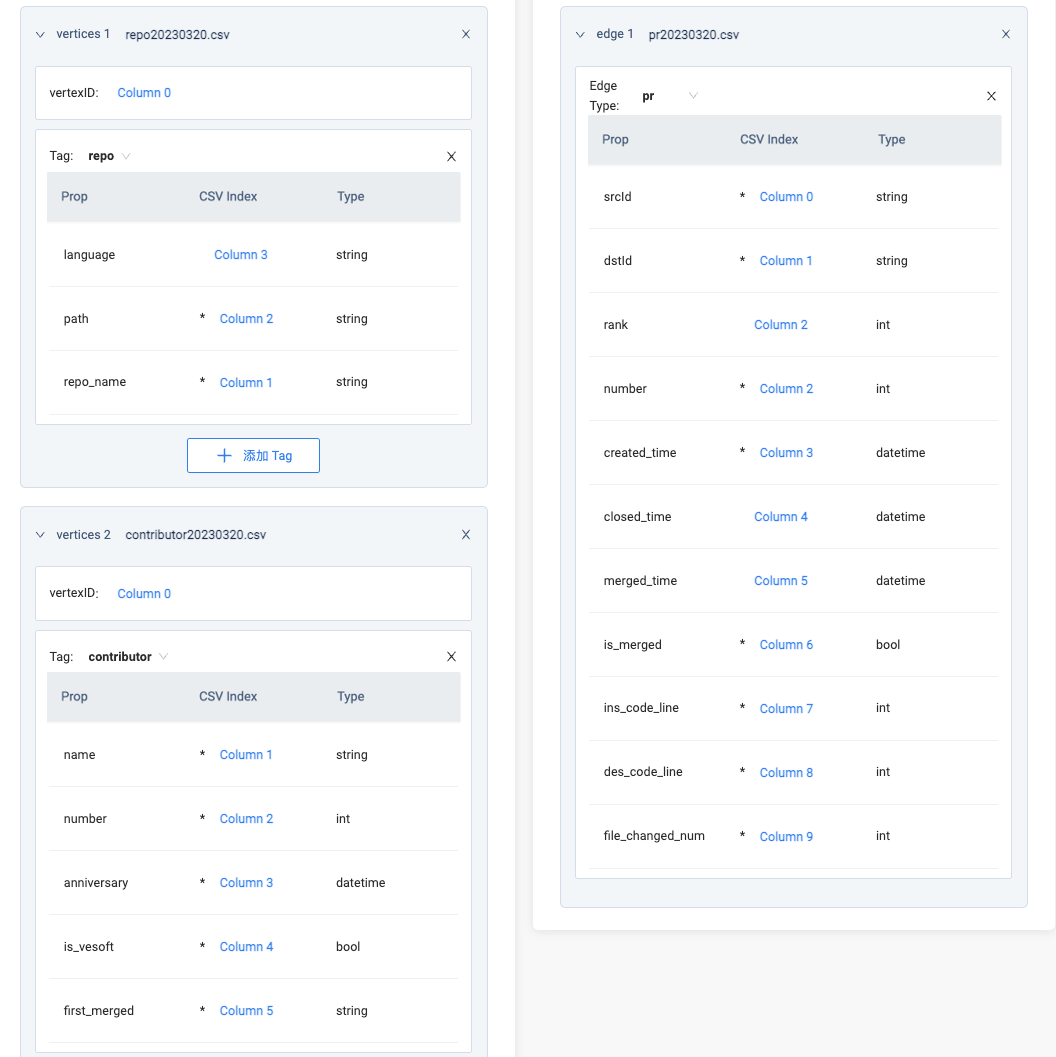
In the entire dataset, we have two types of vertices: vertices 1 associated with repo CSV data and vertices 2 associated with contributor data. After specifying their respective VID and the columns for the relevant properties, you can import the data. In the edge data association part, since we have already added each VID of repo and contributor in the CSV, it's as simple as selecting which column is the source (Column 0) and which column is the destination (Column 1 in the image above).
It is worth mentioning that, since a contributor and a repo may have multiple PR submission records, i.e., multiple edges with the same pr edge type. To deal with this, NebulaGraph introduces a rank field to represent multiple edges of the same type between two vertices but with different edge properties. If you don't set a rank, inserting multiple edges of the same type will result in data overwrite, with the last successfully inserted edge data being the final result.
To save time, I directly used the PR number column as the rank here. If you look closely, both rank and number are reading data from the same Column 2.
Graph Visualization Exploration
We can enter the visual graph exploration mode now that we have the data.
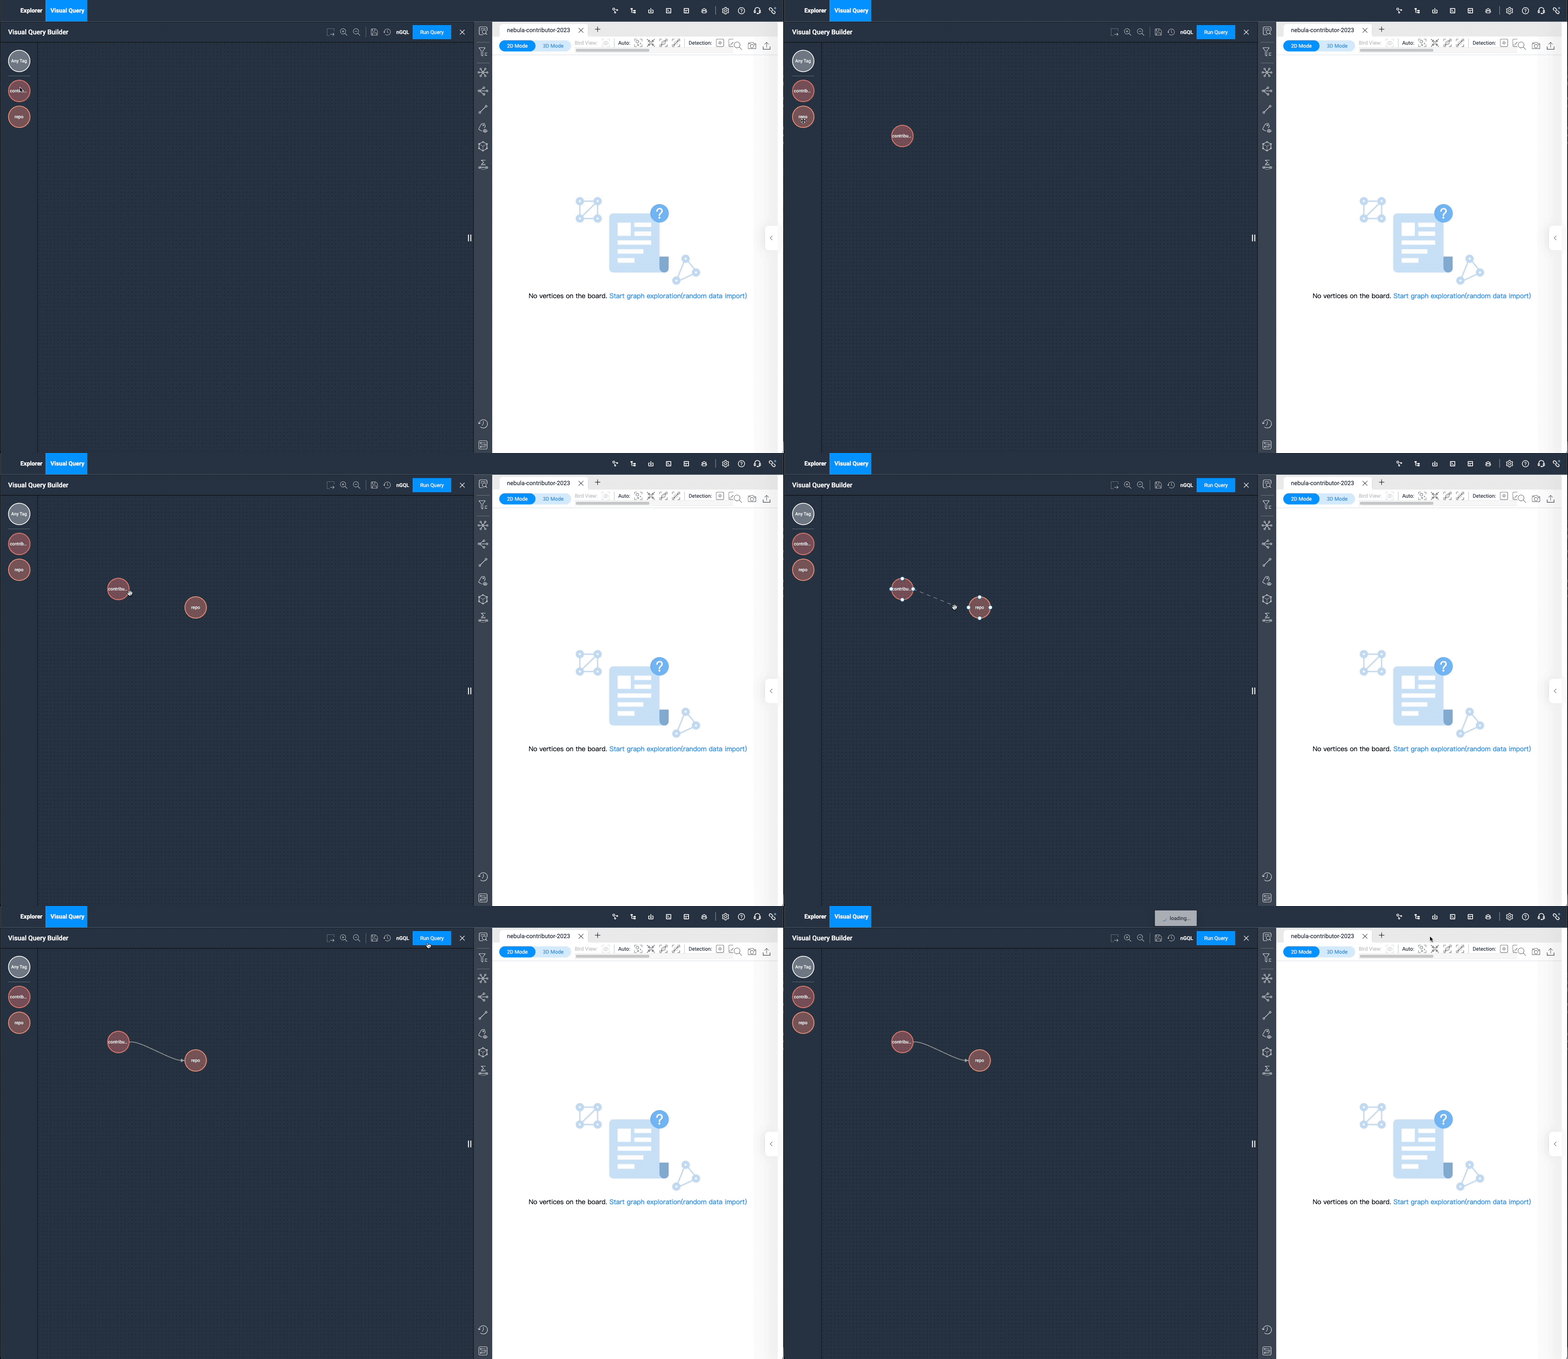
Under the "Visual Query" menu, let’s drag the two tags: contributor and repos, select the pr edge, click "Run", and you can see all the PR data submitted by the contributors. It works exactly like the following nGQL query language:
match (v0:contributor) -[e:pr]-> (v1:repo) return e limit 15000
We can add some small details step by step. After uploading images in batches of contributors and repos, now the overall effect of the graph is as follows:
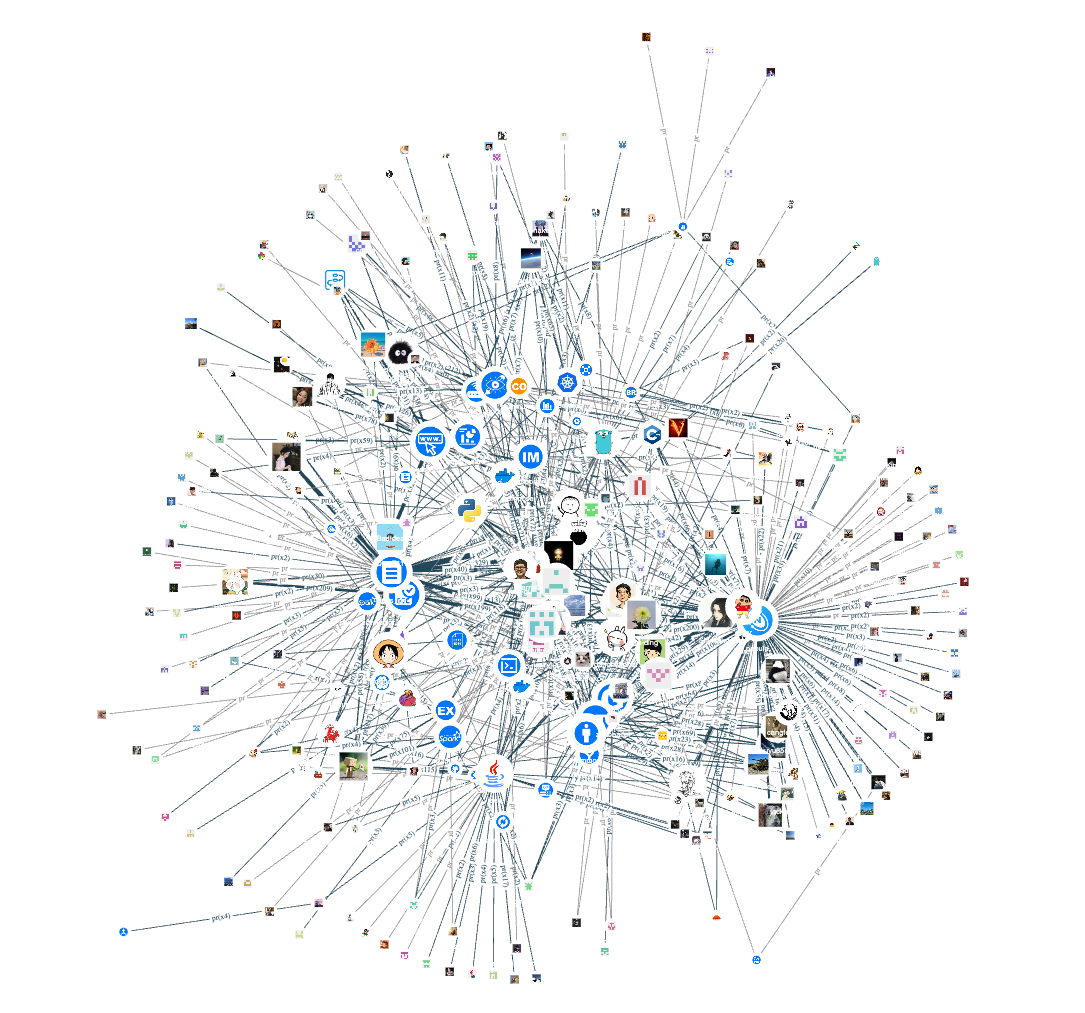
Now let's exclude NebulaGraph employees and take a look at the contribution of community contributors. The effect is the same as the following query language:
match (v0:contributor) -[e:pr]-> (v1:repo) where (v0.contributor.is_vesoft == false) return e limit 15000
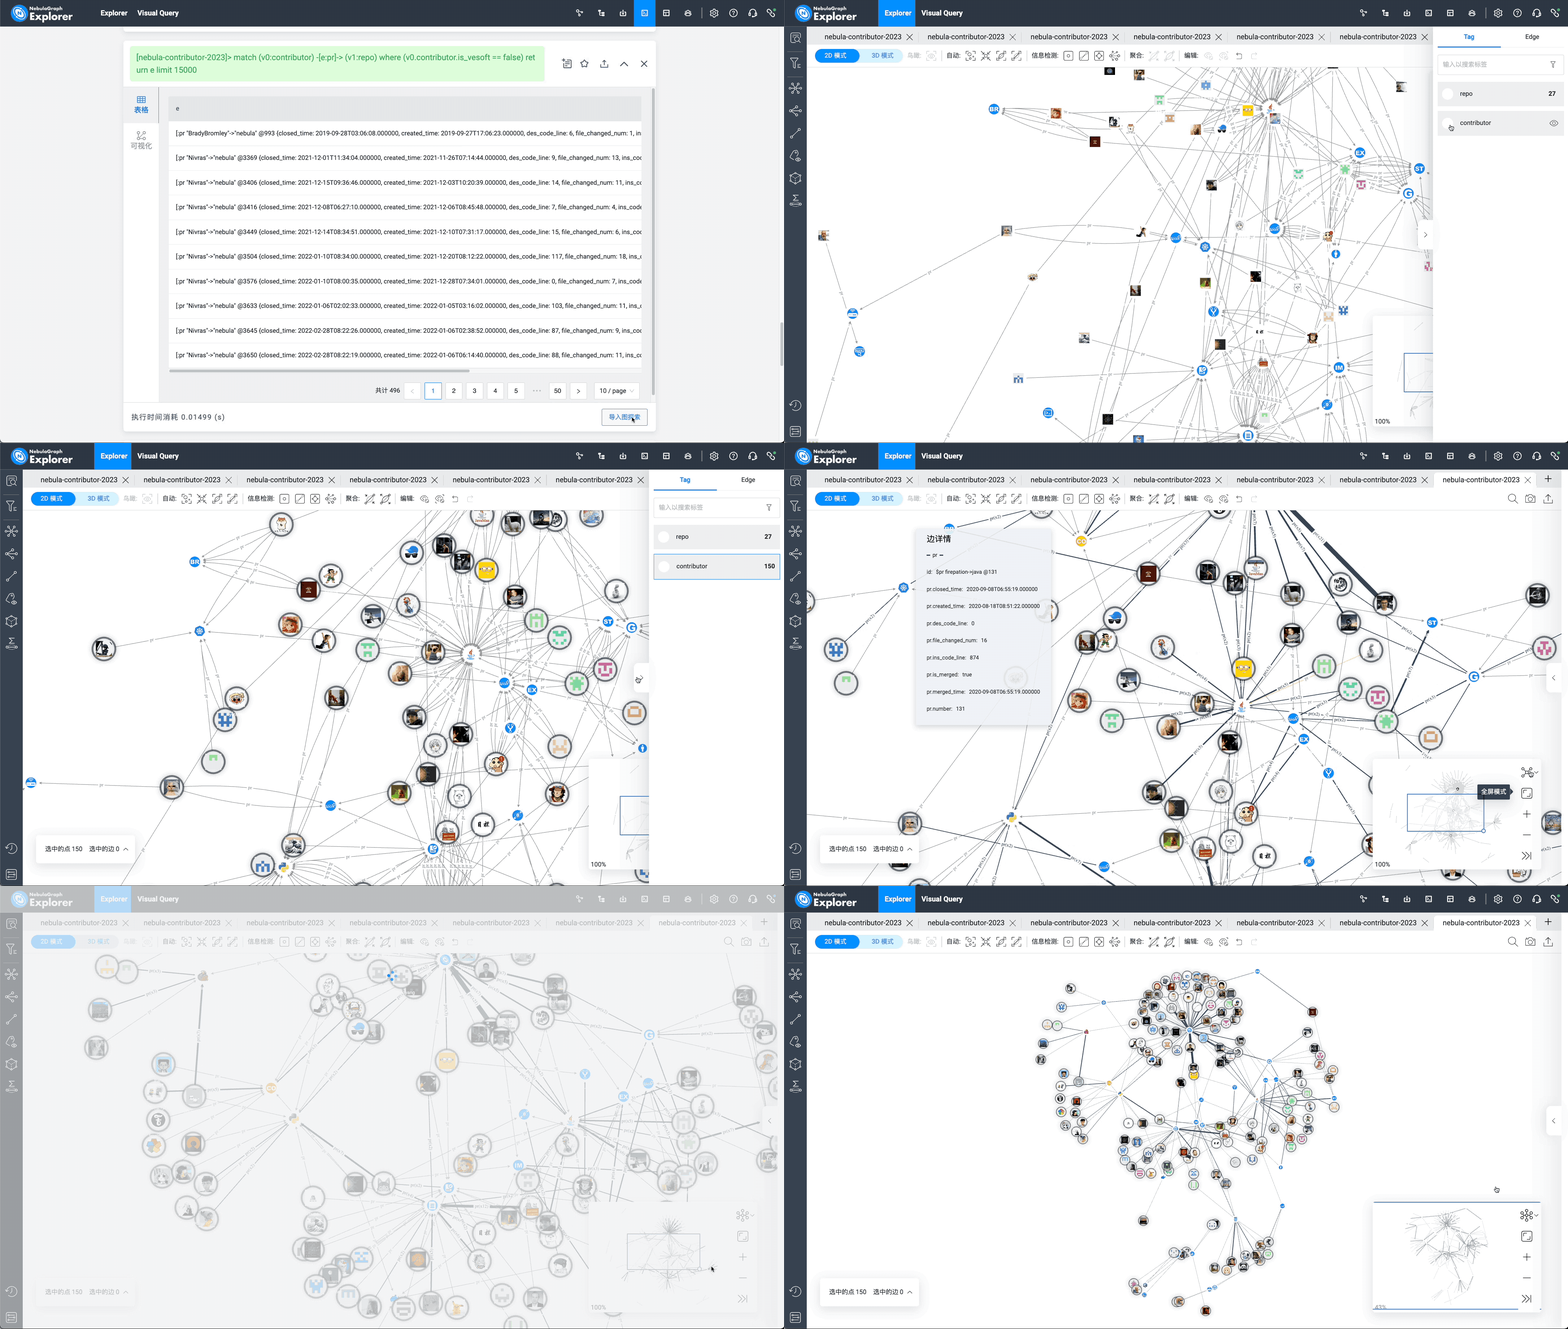
The image above shows the import of the nGQL query results into the canvas. The corresponding operation in NebulaGraph Explorer is to click "Import Graph Exploration", merge edges of the same type, enlarge the contributor vertex size, and select the radial pattern to display the final effect:
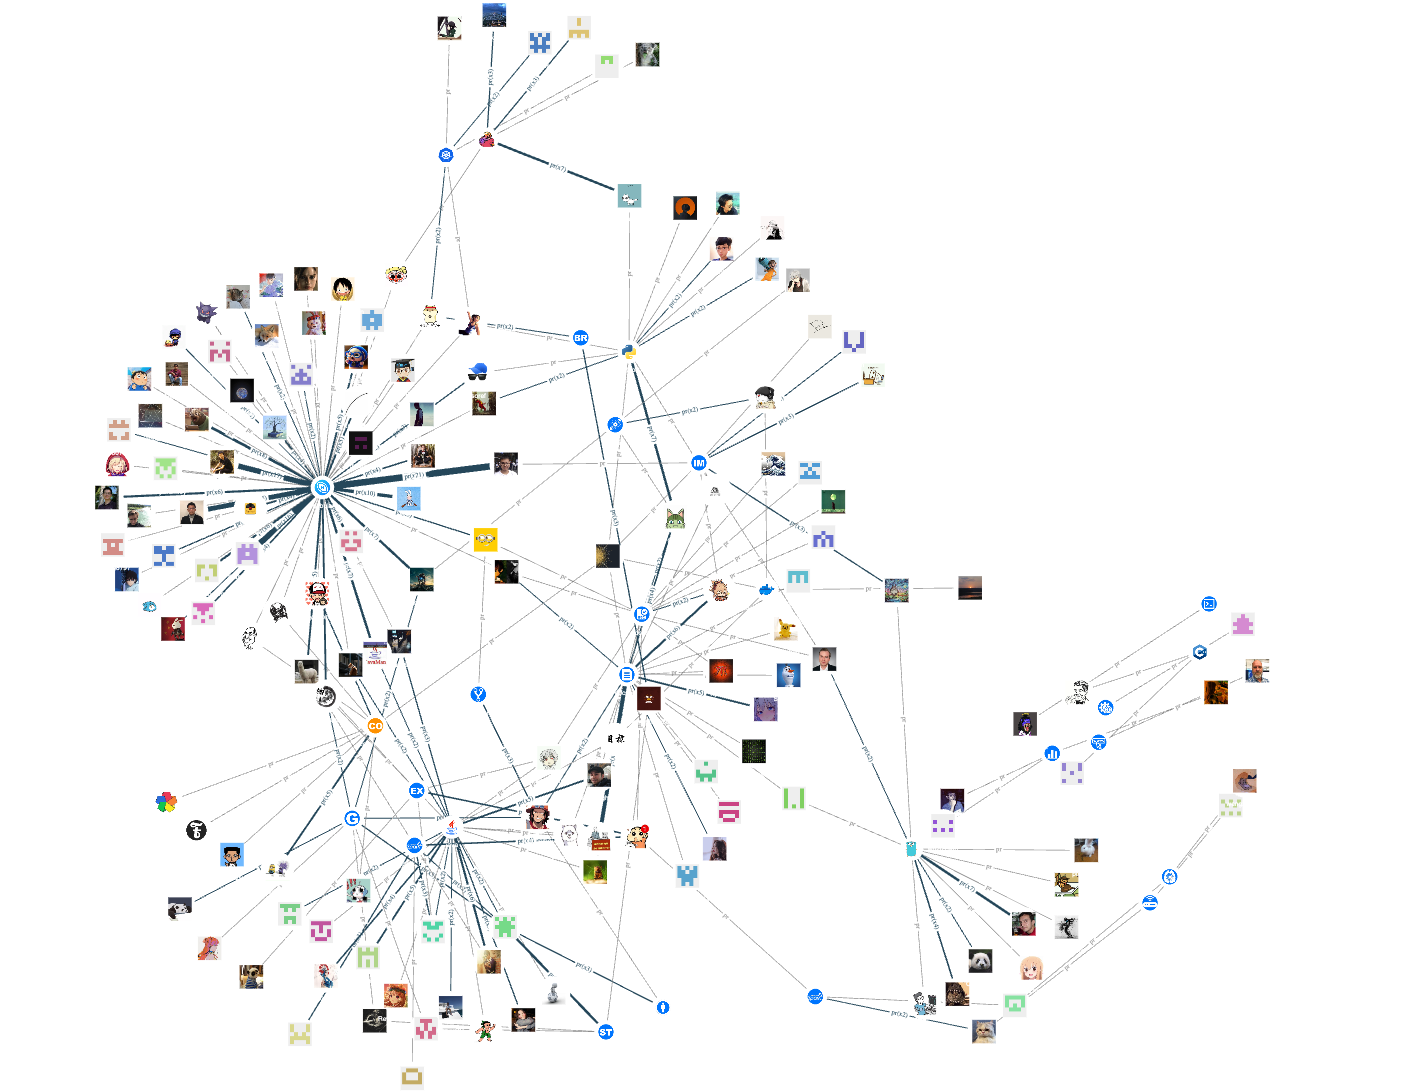
Let's take a look at the contributors of repositories with programming languages C++, Python, Go, and Java:
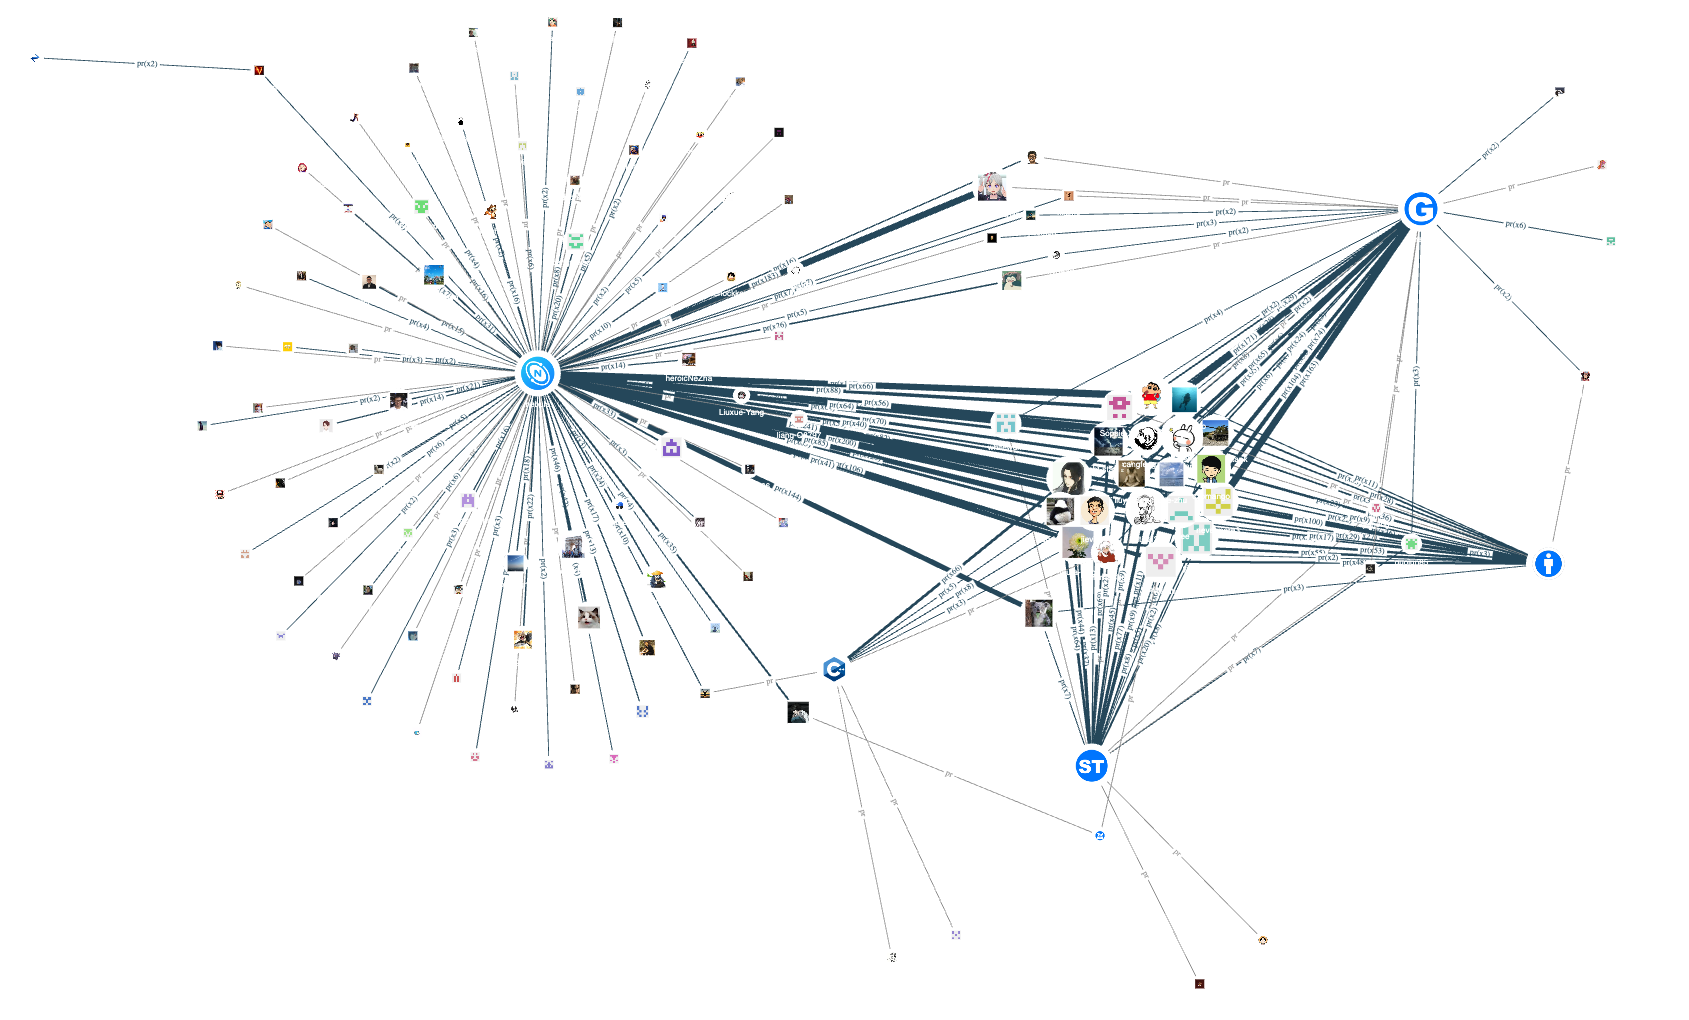
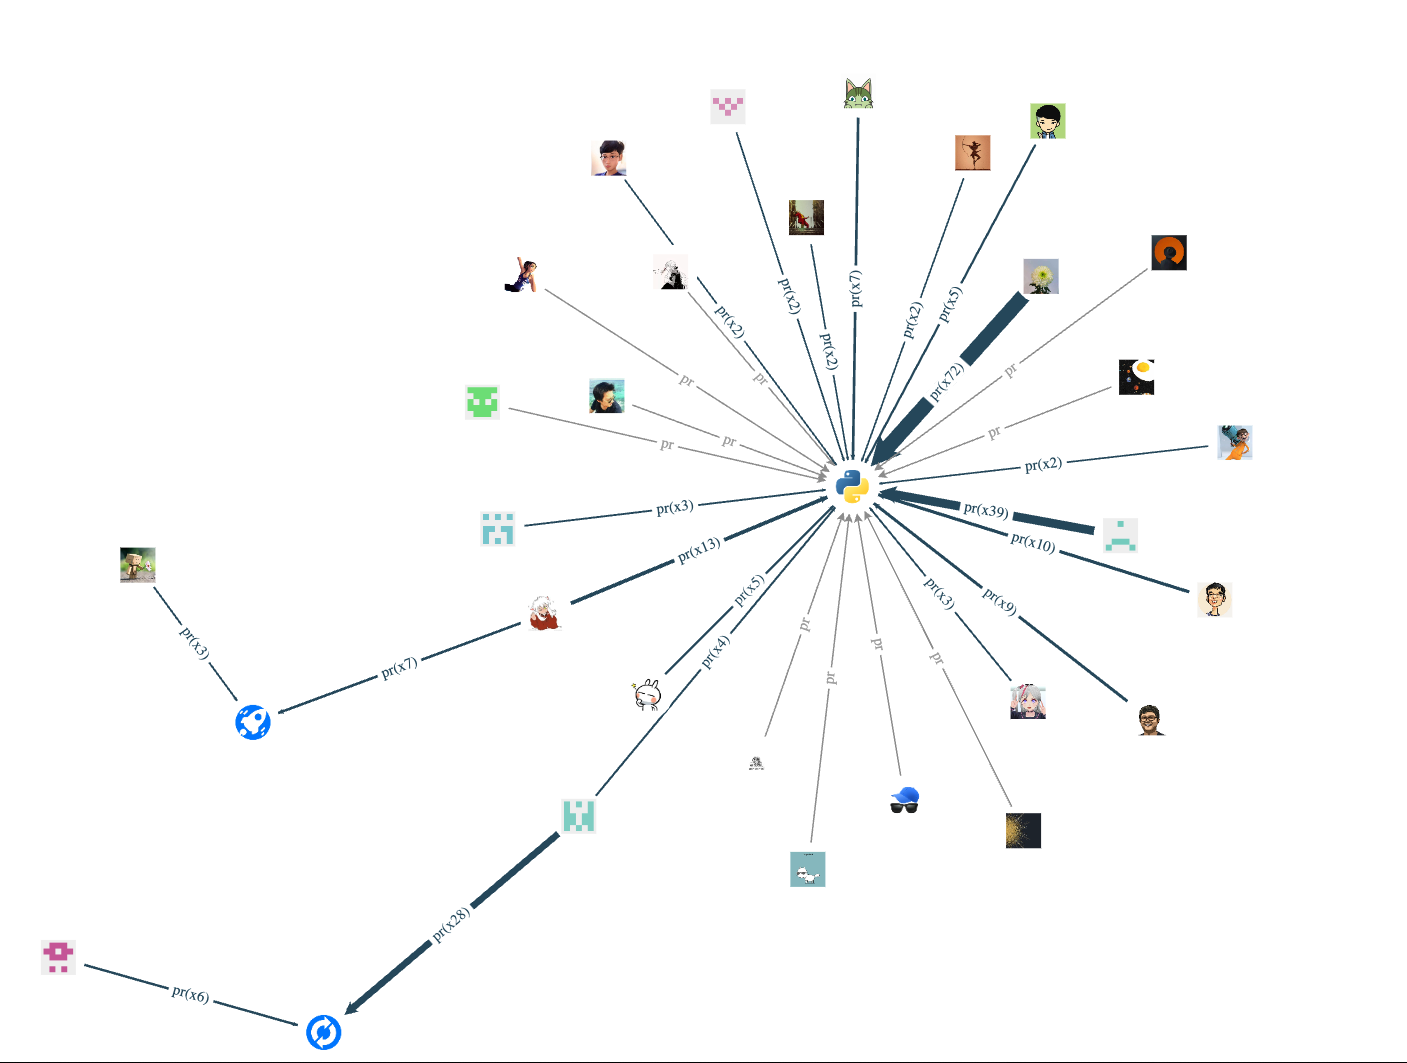
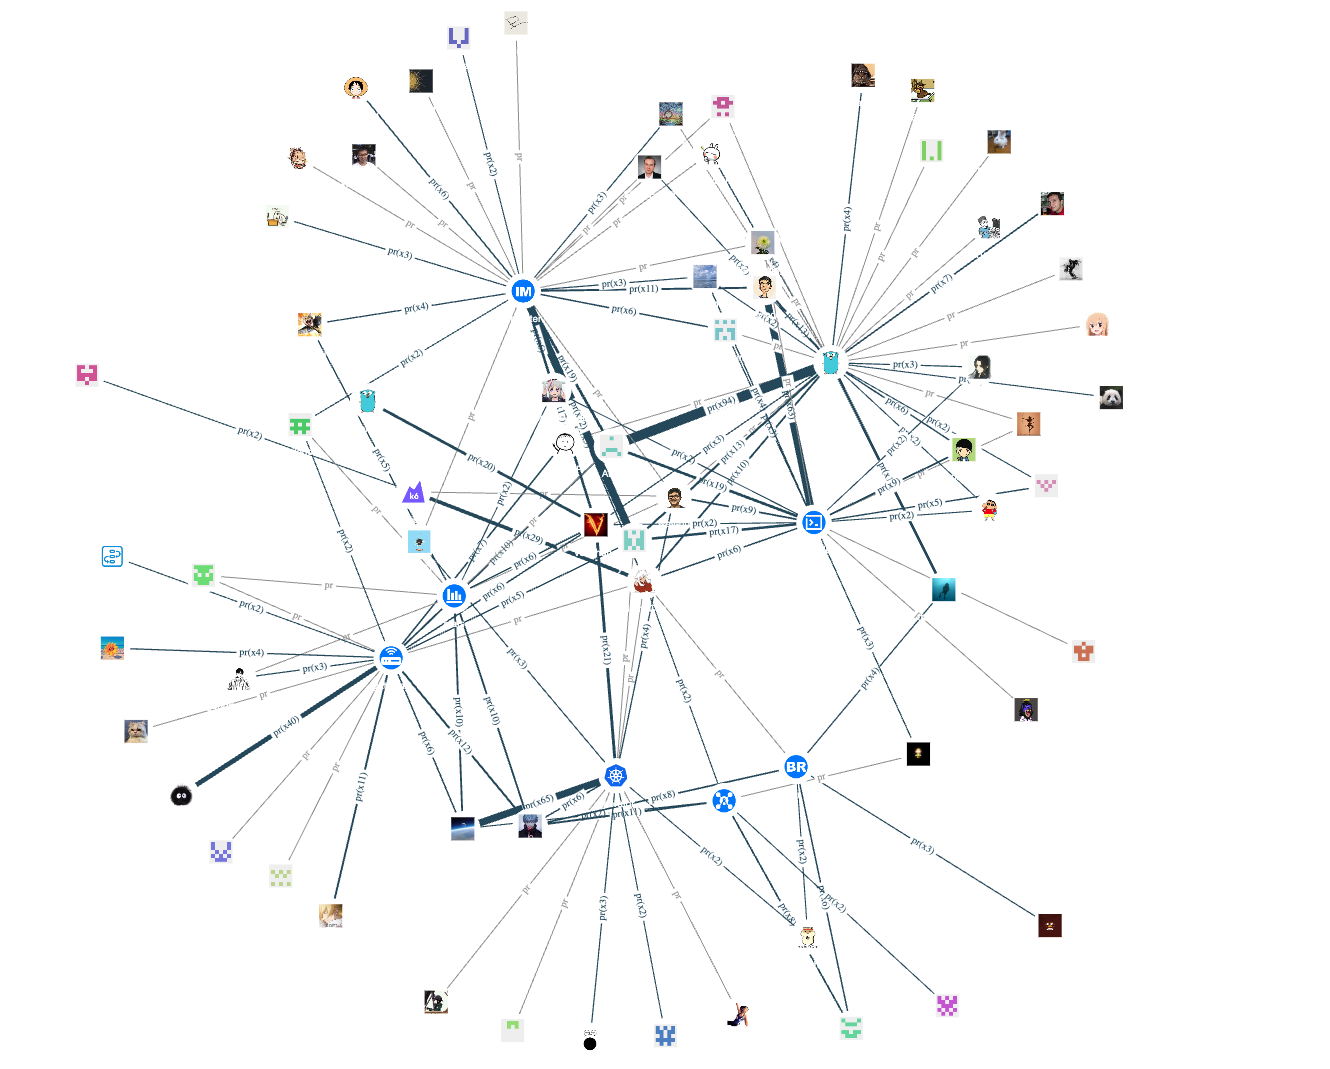
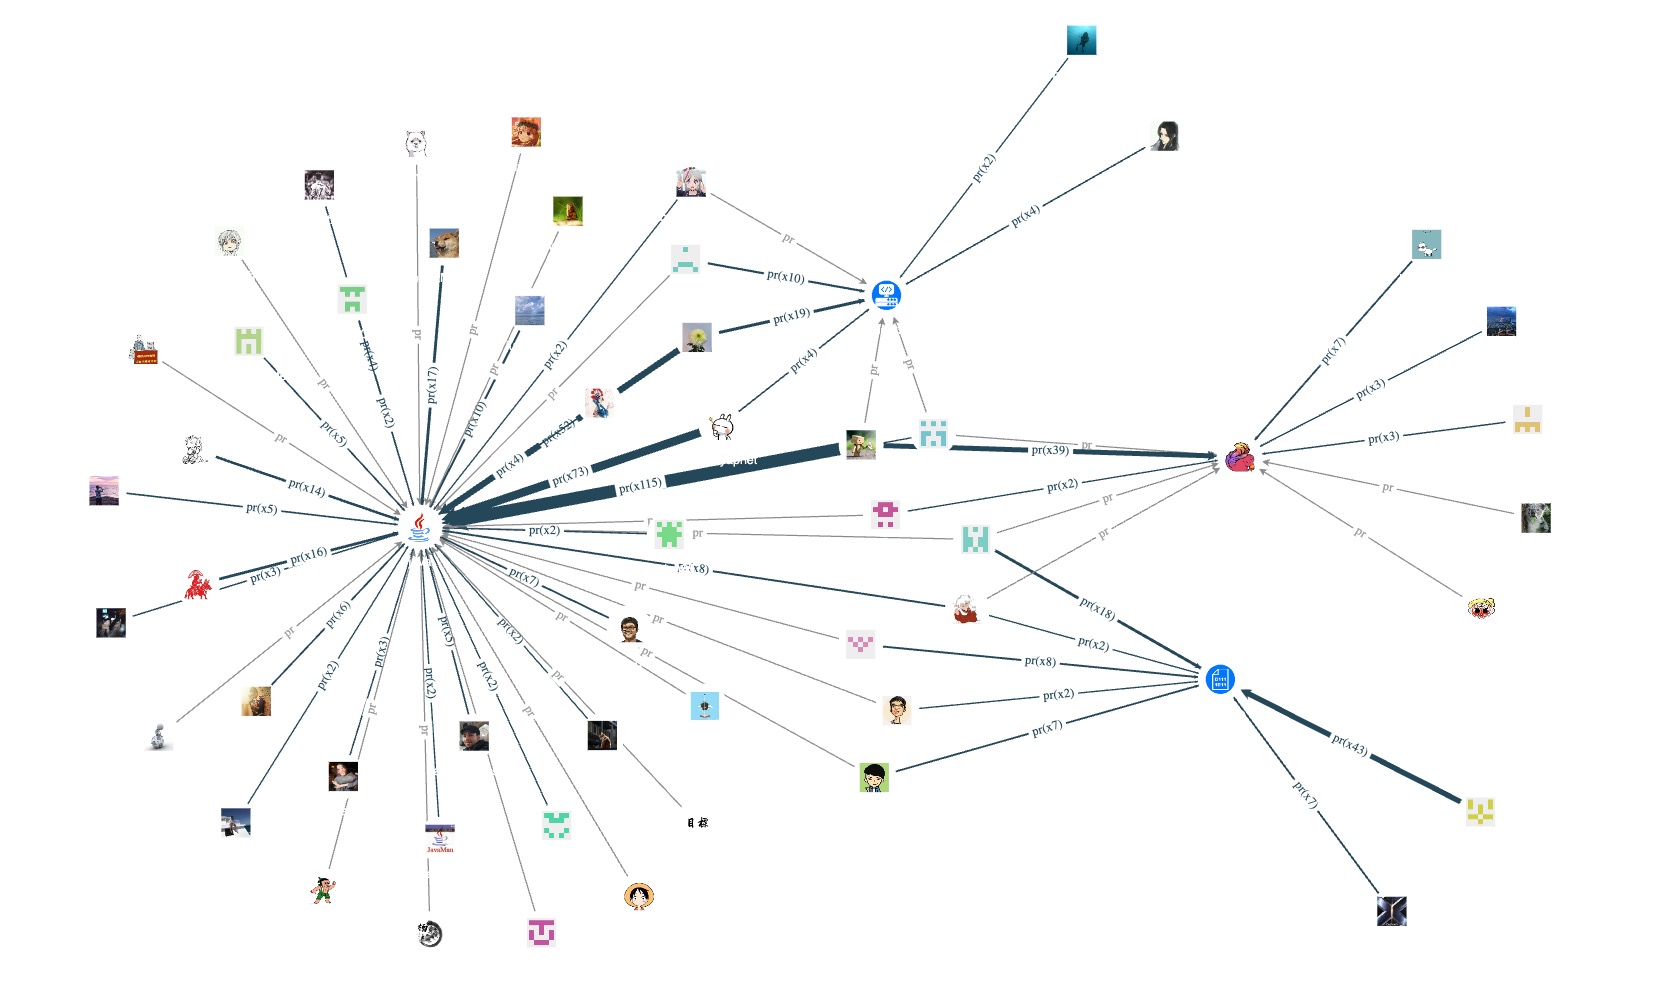
As you can see, the core repository of NebulaGraph uses C++, and many related peripheral tools also use C++. Therefore, there are quite a few C++ contributors (vertices) in the entire open-source project. In contrast, currently, only the Python client nebula-python, synchronization tool auto_sync, and installation tool nebula-ansible are developed using Python language, so the number of contributors is lower than other programming languages.
Speaking of the core repository, let's take a look at the non-employee contributors of the core repository Nebula:
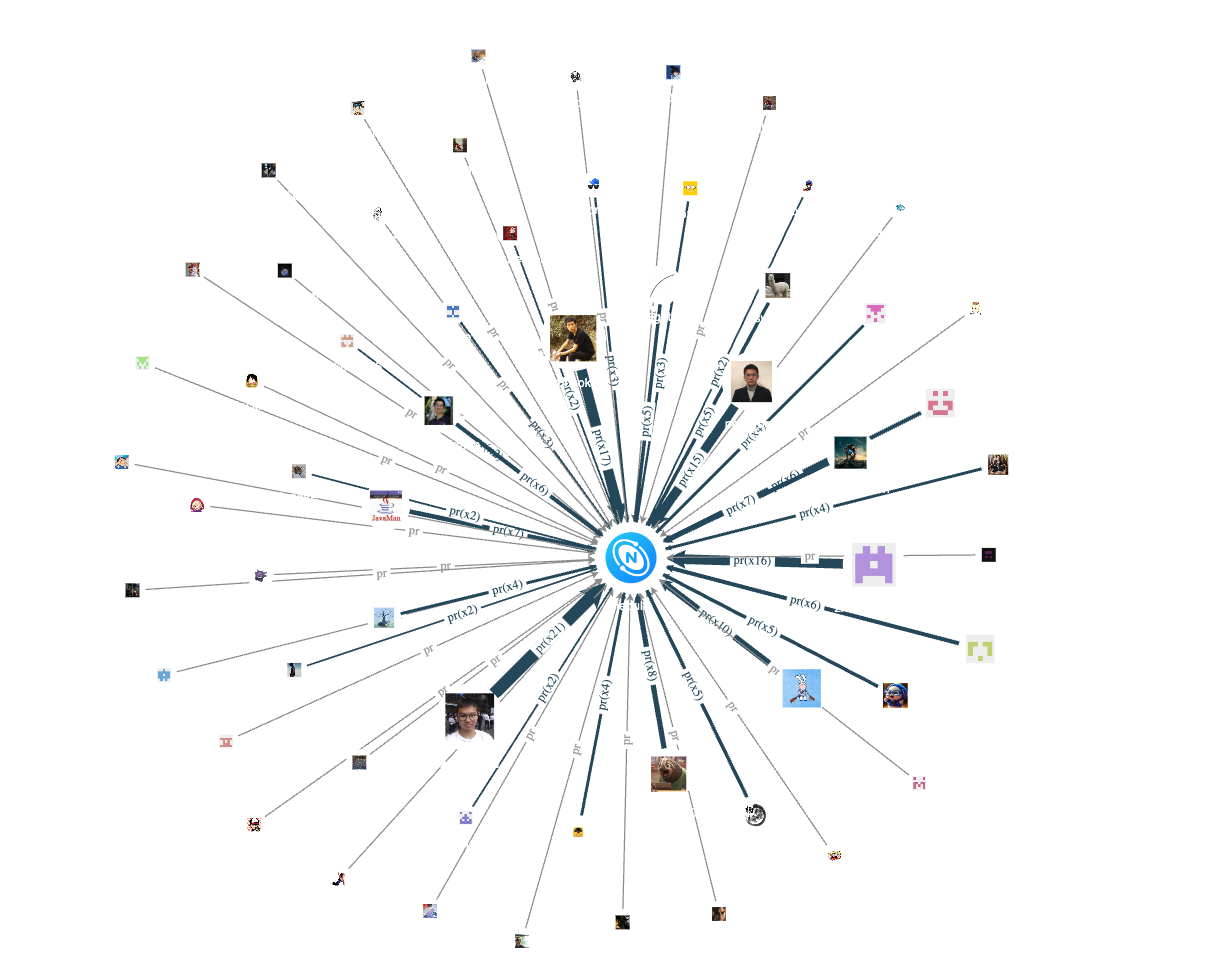
By merging the same type of pr edges, we can see the core repository's active contributors based on the edges' thickness.
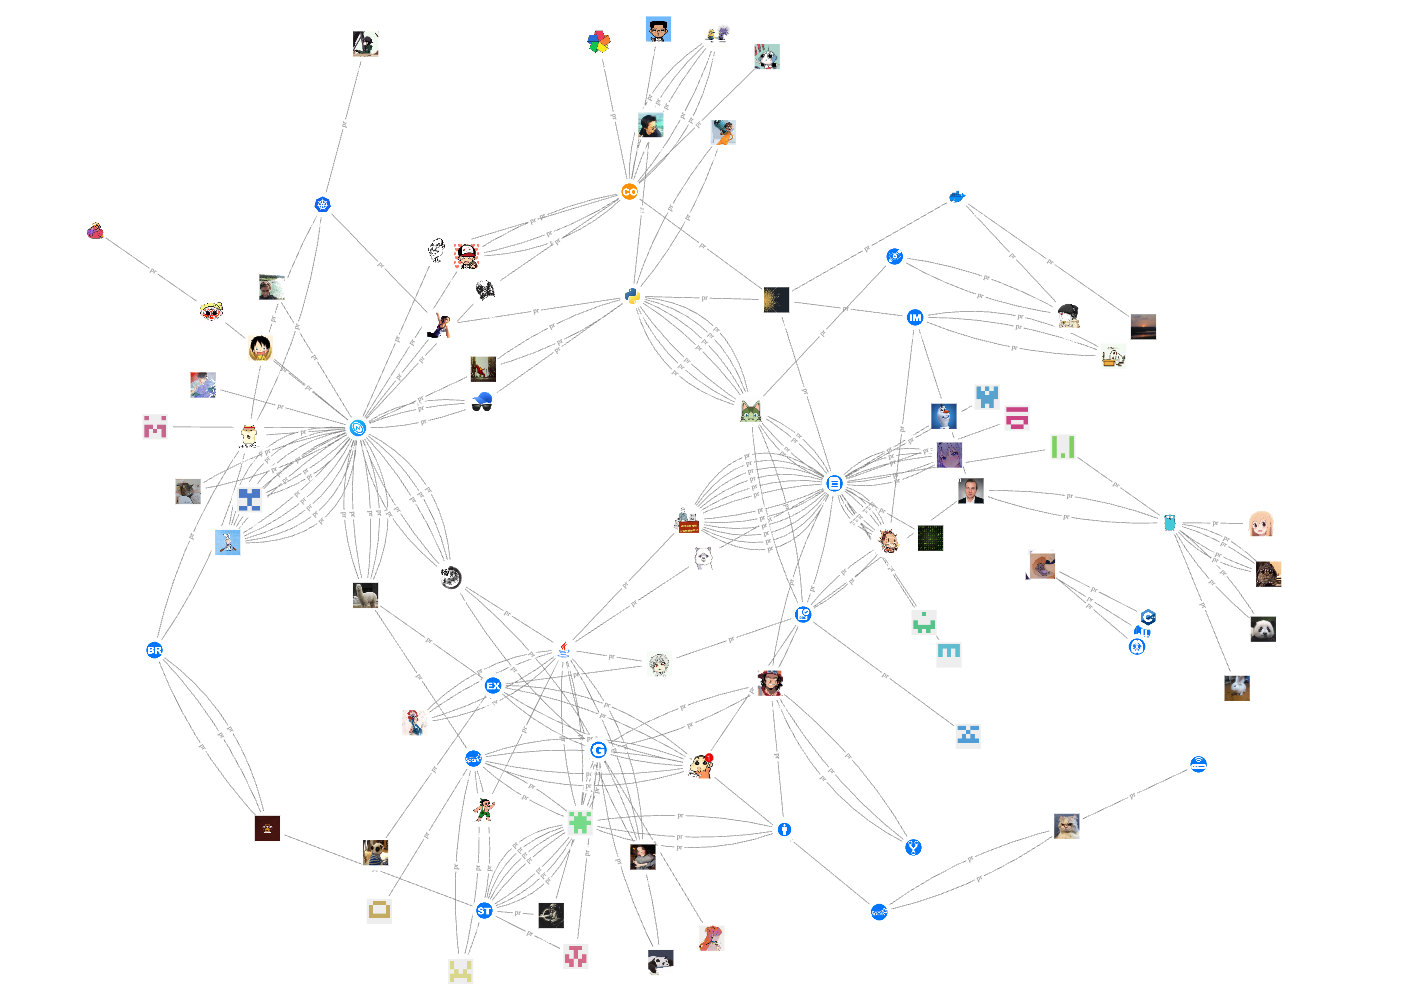
Next, let's take a look at the contributions of non-employee contributors in 2021:
Finally, let's see which PRs have not been merged yet. Here we need to use the is_merged property of the pr edge (remember to create an index for it~):
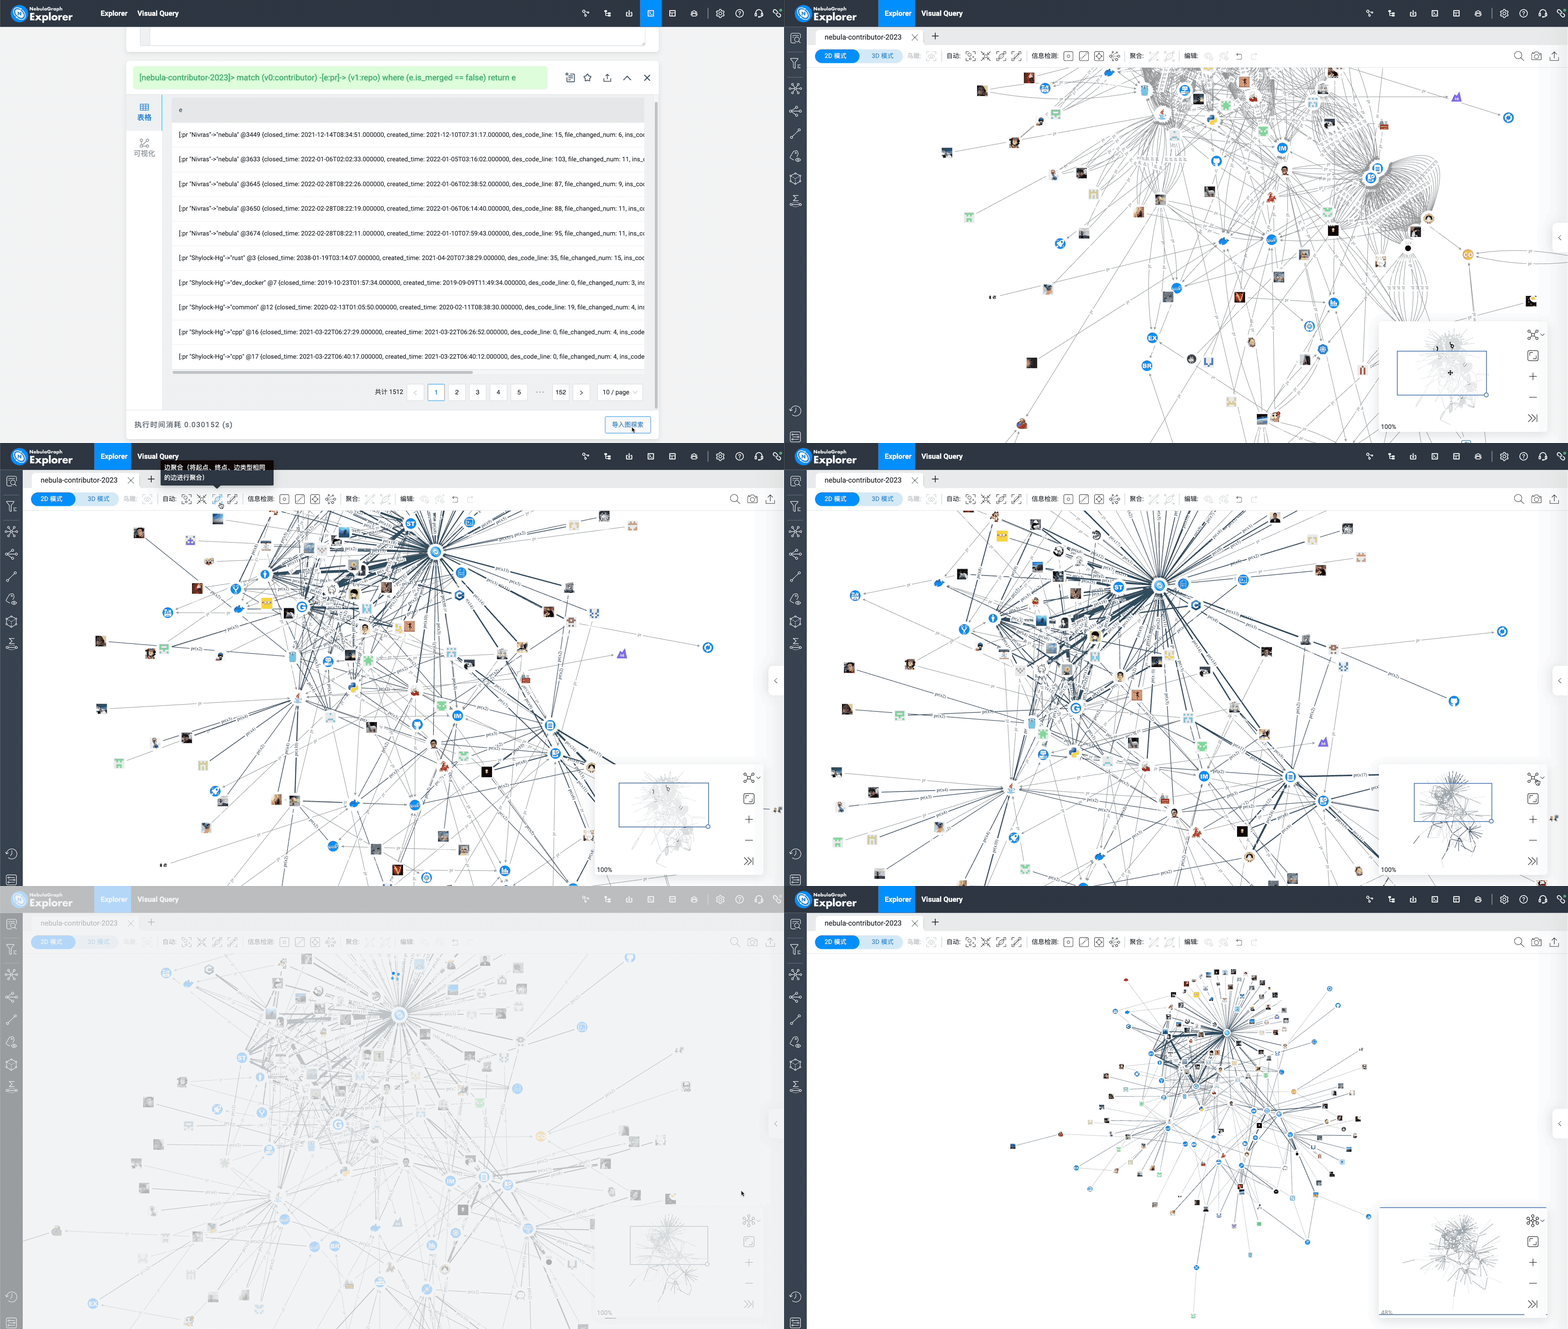
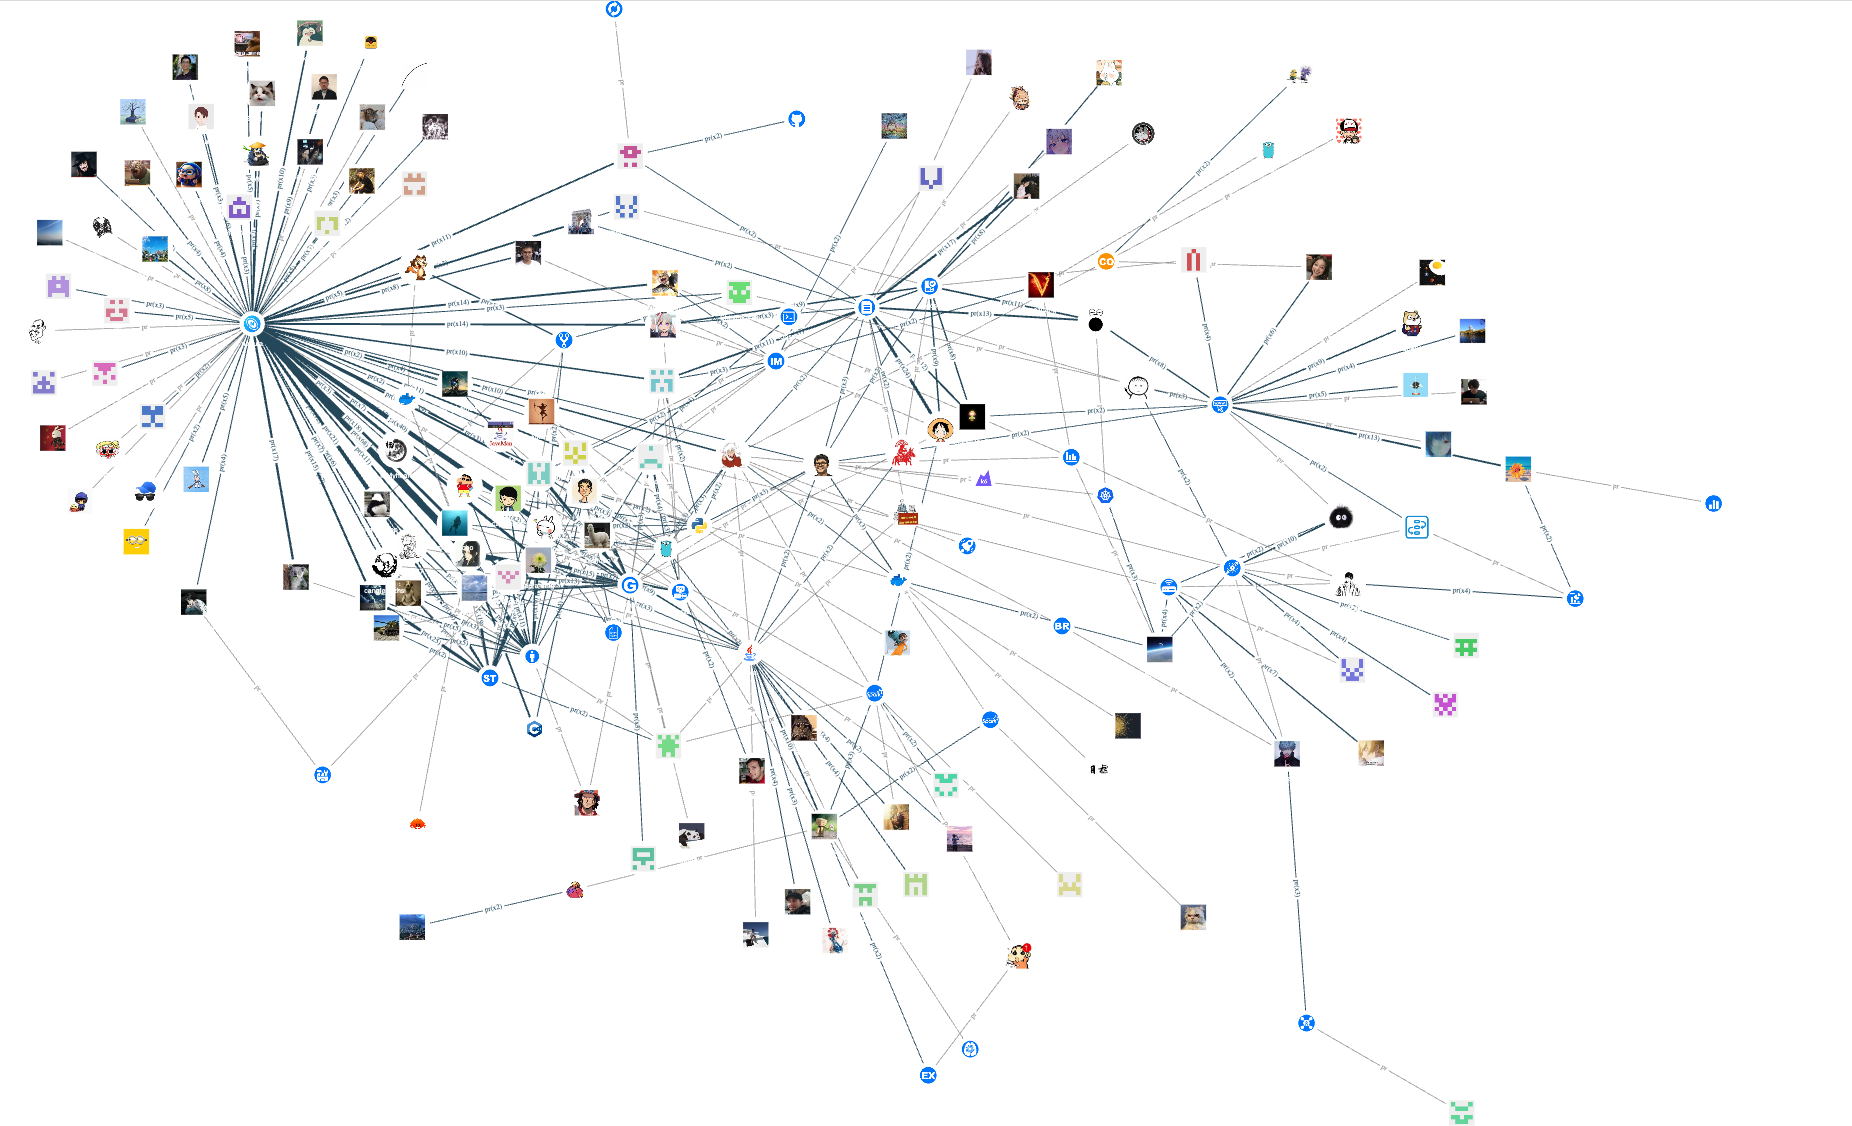
I hope that all the unmerged PRs above can be merged (although this is impossible :-P).
nGQL Collection
Here are the corresponding nGQL query statements for all the query results above:
#  Check the status of contributors in each programming language
match (v0:contributor) -[e:pr]-> (v1:repo) where (v1.repo.language == "C++") return e

match (v0:contributor) -[e:pr]-> (v1:repo) where (v1.repo.language == "Python") return e

match (v0:contributor) -[e:pr]-> (v1:repo) where (v1.repo.language == "Go") return e

match (v0:contributor) -[e:pr]-> (v1:repo) where (v1.repo.language == "Java") return e

# Contributors to nebula-core repo

match (v0:contributor) -[e:pr]-> (v1:repo) where (v1.repo.repo_name == "nebula" and v0.contributor.is_vesoft == false) return e

# Contributors since 2021
match (v0:contributor) -[e:pr]-> (v1:repo) where (v0.contributor.anniversary >= datetime("2021-01-01T00:00:00") and v0.contributor.anniversary < datetime("2022-01-01T00:00:00")  ) and v0.contributor.is_vesoft ==false return e

# Unmerged pr
match (v0:contributor) -[e:pr]-> (v1:repo) where (e.is_merged == false) return e
Dataset Download
This dataset is from NebulaGraph public repo, and the statistical deadline is 2023.03.20. Because some datetime attributes cannot be empty, the empty fields are artificially filled with 2038-01-19 03:14:07 (timestamp type upper limit).
If you are going to use this dataset, remember to pay attention to the handling of datetime property values.
Dataset download address: nebula-contributor-dataset
Finally, let's thank all the contributors of the NebulaGraph Open Source Community.
